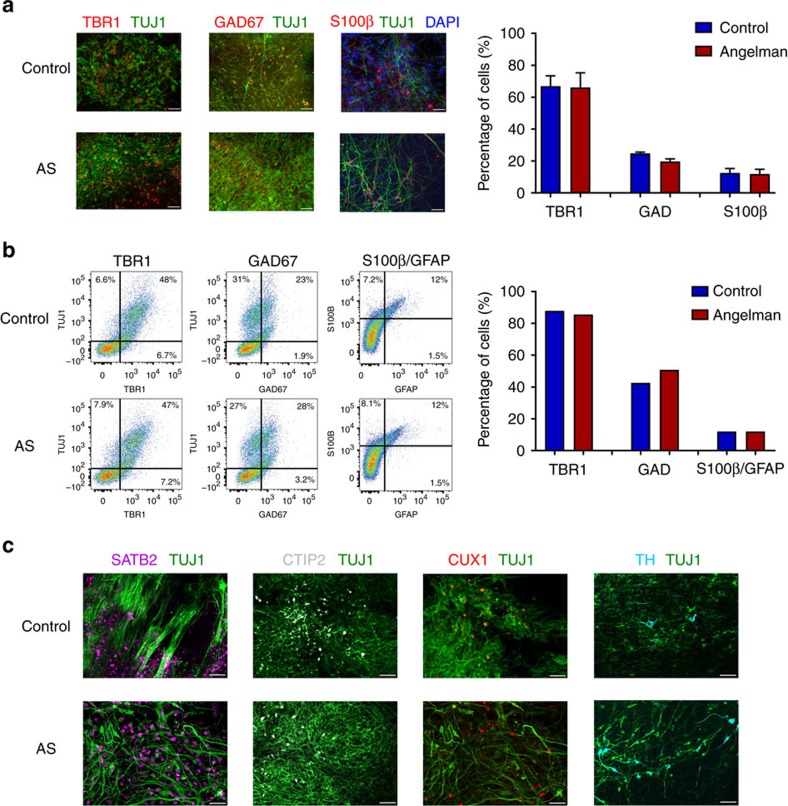
Figure 1. Characterization of cell types in AS and control iPSC-derived cultures.
(a) Left: Immunocytochemical staining for TBR1/TUJ1 and GAD67/TUJ1, and S100β/DAPI, in control and AS-derived cultures. Scale bar, 50 μm. Right: Group data for expression of TBR1-positive and GAD65/67-positive neurons graphed as a percentage of TUJ1-positive neurons at 5 weeks in vitro, and expression of S100β-positive neurons graphed as a percentage of DAPI-positive cells at 17 weeks in vitro. n≥4 coverslips per condition. (b) Left, flow cytometry graphs for TBR1/TUJ1, GAD67/TUJ1 and S100β/GFAP at 16–18 weeks in vitro. Right, quantification of TBR1-positive and GAD67-positive neurons as a percentage of TUJ1-positive neurons, and S100β/GFAP-positive neurons as a percentage of DAPI-positive cells. (c) Immunocytochemical staining for SATB2, CTIP2, CUX1 and TH in control and AS-derived cultures at 10–22 weeks in vitro. For each cell marker, matching AS and control experiments were done at similar ages. Scale bar, 50 μm. Error bars represent mean ±s.e.m.

