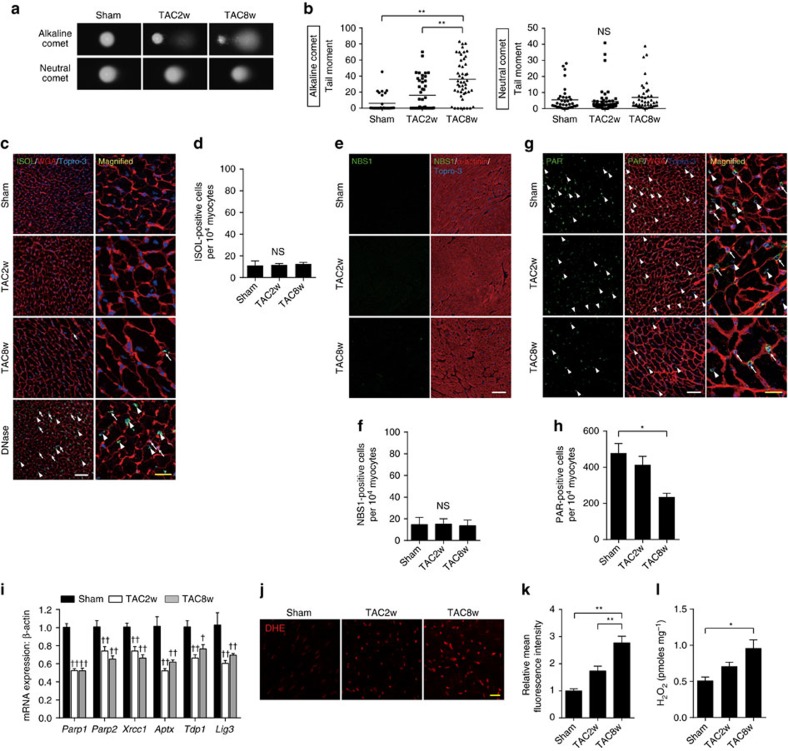
Figure 1. Accumulation of DNA SSB in the failing heart.
(a,b) Cardiomyocytes were isolated from the TAC-operated heart at the indicated time points. The type of DNA damage in cardiomyocytes was assessed by comet assay. Representative images (a) and quantitative analyses are shown (b, Alkaline comet: n=28, 45, 48; Neutral comet: n=38, 56, 44 at each time point, respectively, biological replicates=3). (c,d) Fragmented DNA and DSB were labelled with ISOL staining (c, green). Wheat germ agglutinin (WGA, red) was used to visualize cardiomyocytes. DNase-treated section (DNase I, 10 Kunitz units ml−1) was used as a positive control. Arrowheads indicate ISOL-positive cardiomyocytes and arrows indicate ISOL-positive non-cardiomyocytes. White scale bar, 50 μm; yellow scale bar, 20 μm. The number of ISOL-positive cardiomyocytes was counted (d, n=4 each). (e,f) Heart tissue sections were immunostained for NBS1 (e, NBS1, green). Immunostaining for alpha-actinin (red) was used to label cardiomyocytes. Scale bar, 50 μm. The number of NBS1-positive cardiomyocytes was counted (f, n=4 each). (g,h) Heart tissue sections were immunostained for poly-ADP ribose (g, PAR, green) and the number of PAR-positive cardiomyocytes was counted (h, n=4, 4, 5 at each time point, respectively). Arrowheads indicate PAR-positive cardiomyocytes and arrows indicate PAR-positive non-cardiomyocytes. White scale bar, 50 μm; yellow scale bar, 20 μm. (i) Expression levels of SSB repair enzymes were analysed by real-time PCR (n=4, 6, 8 at each time point, respectively, technical duplicates). (j,k) Heart tissue sections were stained with dihydroethidium (i, DHE, 10 μΜ) and mean fluorescence intensity relative to Sham-operated mice was measured (k, n=4, 5, 5 at each time point, respectively). Scale bar, 50 μm. (l) The level of H2O2 in the TAC-operated heart was measured using Amplex Red assay (n=9, 5, 6 at each time point, respectively). Statistical significance was determined by Steel-Dwass test for (b) and by one-way analysis of variance followed by the Tukey–Kramer HSD test for (d,f,h,i,j) *P<0.05; **P<0.01 between arbitrary two groups. †P<0.05; ††P<0.01 versus Sham. Column and error bars show mean and s.e.m., respectively.

