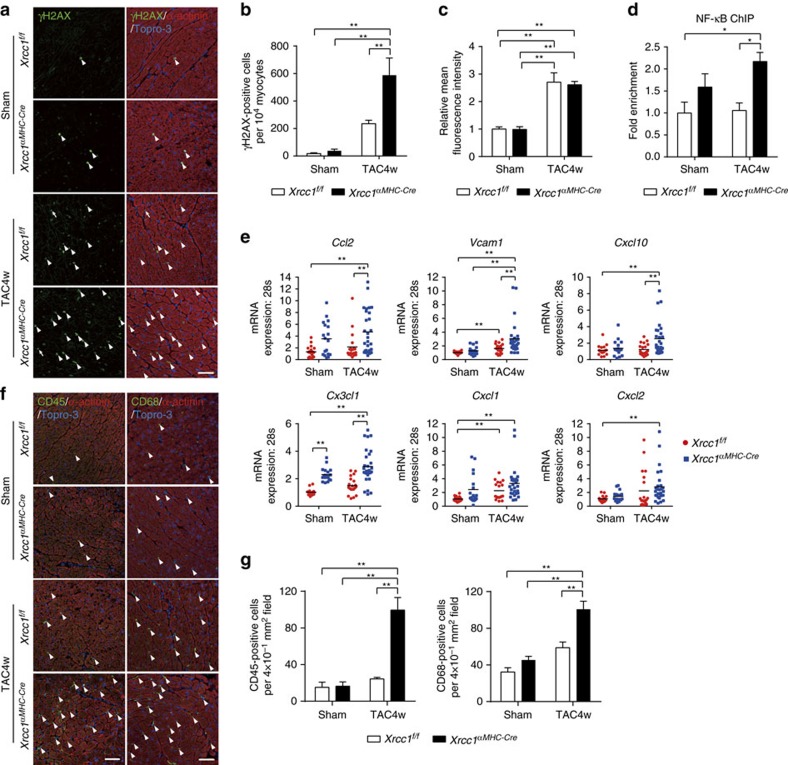
Figure 5. Xrcc1 deficiency exacerbates cardiac inflammation after pressure overload.
(a,b) Activation of DDR in Sham- or TAC-operated Xrcc1f/f and Xrcc1αMHC-Cre mice was assessed by immunostaining for phosphorylated H2AX (a, γH2AX, green). Immunostaining for alpha-actinin (red) was used to label cardiomyocytes. Arrowheads indicate γH2AX-positive cardiomyocytes and arrows indicate γH2AX-positive non-cardiomyocytes. Scale bar, 50 μm. The number of γH2AX-positive cardiomyocytes was counted (b, n=4 each). Statistical significance was determined by one-way analysis of variance (ANOVA) followed by the Tukey–Kramer HSD test. **P<0.01 between arbitrary two groups. (c) Heart tissue sections were stained with dihydroethidium and mean fluorescence intensity relative to Sham-operated Xrcc1f/f mice was measured (n=5 each). Statistical significance was determined by one-way ANOVA followed by the Tukey–Kramer HSD test. **P<0.01 between arbitrary two groups. (d) ChIP–qPCR analysis of binding of NF-κB to the Vcam1 promoter region in Sham- or TAC-operated Xrcc1f/f and Xrcc1αMHC-Cre mice. Data are presented as fold enrichment relative to Sham-operated Xrcc1f/f mice (n=4, 4, 5, 5, respectively). Statistical significance was determined by one-way ANOVA followed by the Tukey–Kramer HSD test. *P<0.05 between arbitrary two groups. (e) The expression levels of inflammatory cytokines in the isolated cardiomyocytes of Sham- or TAC-operated Xrcc1f/f and Xrcc1αMHC-Cre mice was assessed by real-time PCR (n=18, 18, 18, 28, respectively, technical duplicates). Statistical significance was determined by one-way ANOVA followed by the Tukey-Kramer HSD test. **P<0.01 between arbitrary two groups. (f,g) Heart tissues of Sham- or TAC-operated Xrcc1f/f and Xrcc1αMHC-Cre mice were immunostained for CD45 or CD68 (f, green). Immunostaining for alpha-actinin (red) was used to label cardiomyocytes. Arrowheads indicate CD45- or CD68-positive cells. Scale bar, 50 μm. The number of CD45- and CD68-positive cells was counted (g, n=5 each). Statistical significance was determined by one-way ANOVA followed by the Tukey-Kramer HSD test. **P<0.01 between arbitrary two groups. Column and error bars show mean and s.e.m., respectively.

