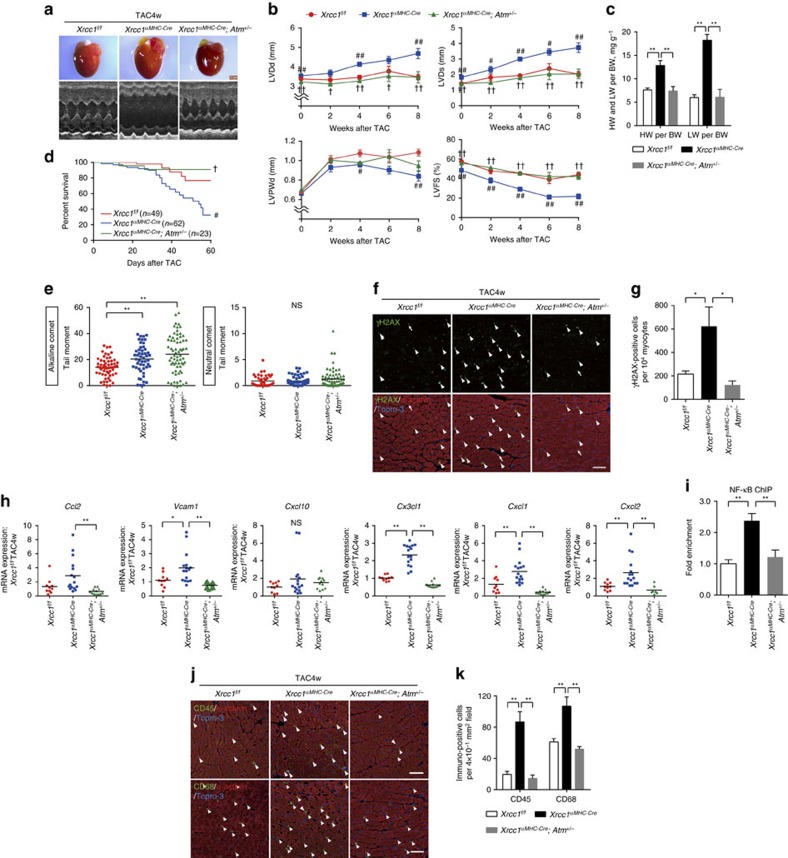
Figure 7. ATM gene deletion rescues the cardiac phenotypes of Xrcc1 deficient mice.
(a,b) Macroscopic and echocardiographic images (a) and cardiac function (b) of TAC-operated Xrcc1f/f, Xrcc1αMHC-Cre and Xrcc1αMHC-Cre; Atm+/− mice (Xrcc1f/fmice: n=83, 21, 46, 11, 27; Xrcc1αMHC-Cre mice: n=88, 28, 60, 13, 16; Xrcc1αMHC-Cre; Atm+/− mice: n=28, 22, 22, 7, 7 at each time point, respectively). Scale bar, 2 mm. (c) Heart, lung, and body weight of TAC-operated Xrcc1f/f, Xrcc1αMHC-Cre and Xrcc1αMHC-Cre; Atm+/− mice were weighed 8 weeks after the surgery (n=8, 5, 6 for each genotype, respectively). (d) Survival curves of TAC-operated Xrcc1f/f, Xrcc1αMHC-Cre and Xrcc1αMHC-Cre; Atm+/− mice (n=49, 62, 23, respectively). (e–k) TAC-operated Xrcc1f/f, Xrcc1αMHC-Cre and Xrcc1αMHC-Cre; Atm+/− mice were analysed 4 weeks after the surgery. The type of DNA damage in cardiomyocytes was assessed by comet assay (e, Alkaline comet: n=50, 76, 77; Neutral comet: n=53, 56, 42, respectively). Activation of DDR was assessed by immunostaining for phosphorylated H2AX (f, γH2AX, green, arrowheads). Arrowheads indicate γH2AX-positive cardiomyocytes and arrows indicate γH2AX-positive non-cardiomyocytes. Scale bar, 50 μm. The number of γH2AX-positive cardiomyocytes was counted (g, n=4 each). Expression levels of inflammatory cytokines in the isolated cardiomyocytes were assessed by real-time PCR (h, n=10, 16, 12 for each genotype, respectively, technical duplicates). ChIP–qPCR analysis of binding of NF-κB to the Vcam1 promoter region. Data is presented as fold enrichment relative to TAC-operated Xrcc1f/f mice (i, n=4, 5, 5, respectively). Heart tissues were immunostained for CD45 or CD68 (j, green, arrowheads). Arrowheads indicate CD45- or CD68-positive cells. Scale bar, 50 μm. The number of CD45- and CD68-positive cells was counted (k, n=4 each). Statistical significance was determined by one-way analysis of variance followed by the Tukey–Kramer HSD test for (b) (at each time point), (c,g,h,i,k), by Wilcoxon test for d and by Steel–Dwass test for e, #P<0.05; ##P<0.01 between Xrcc1f/f and Xrcc1αMHC-Cre mice. †P<0.05; ††P<0.01 between Xrcc1αMHC-Cre and Xrcc1αMHC-Cre; Atm+/− mice. *P<0.05; **P<0.01 between arbitrary two groups. Column and error bars show mean and s.e.m., respectively.

