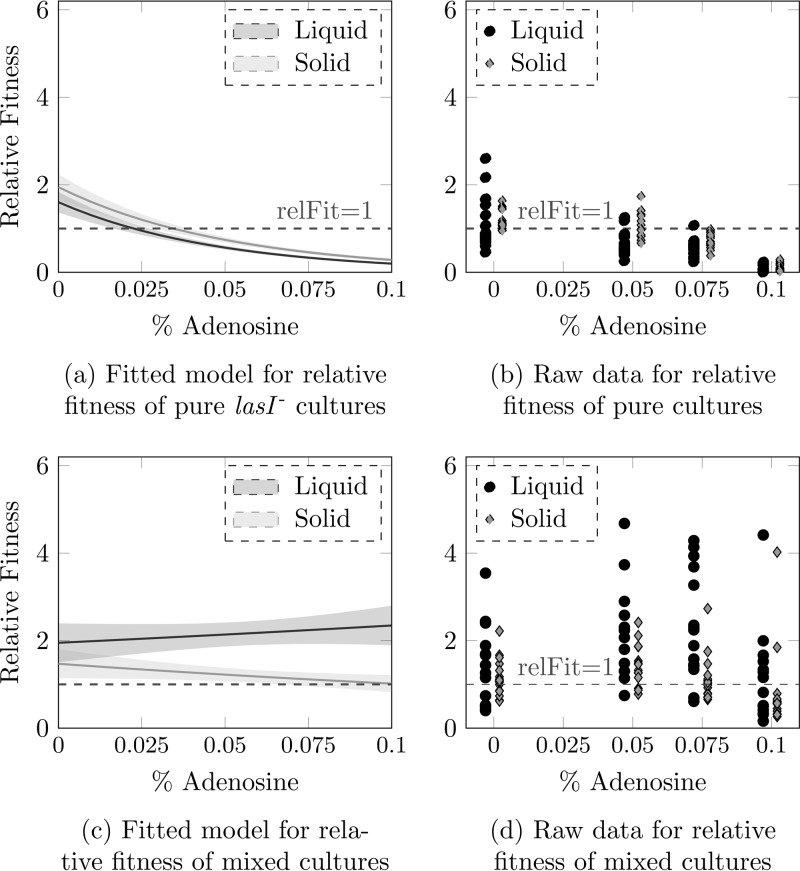
FIG 3 .
Comparison of lasI mutant relative fitness in pure culture (a and b) or mixed culture with the wild type (c and d). Panels a and c show the results of fitting generalized linear models to relative fitness data from experiments in liquid versus agar-supplemented medium. Lines show fitted models; shaded areas denote standard deviations. Raw data are shown in panels b and d (black circles, liquid medium; gray diamonds, agar-supplemented medium).

