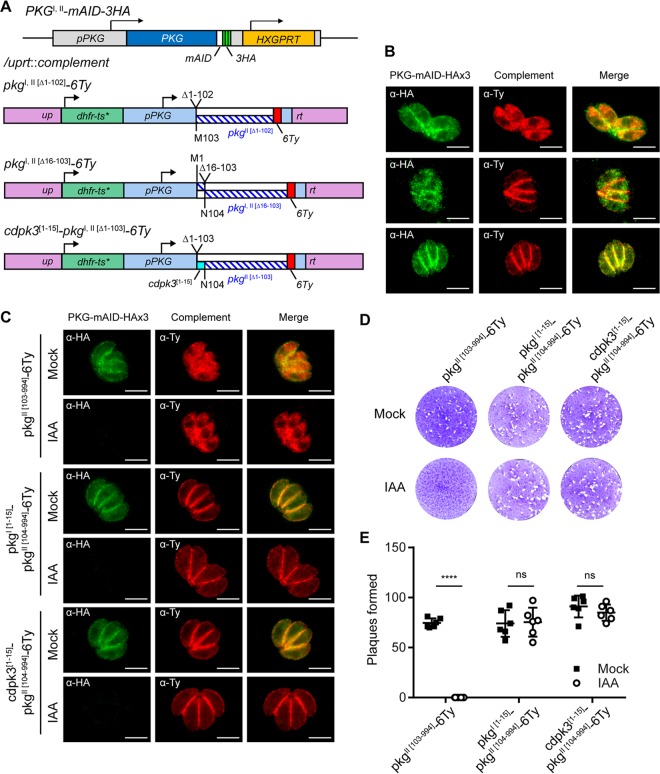
FIG 6 .
Plasma membrane localization functionally distinguishes PKGI from PKGII. (A) Schematic of the CRISPR/Cas9 strategy used to insert a second copy of PKG or mutant isoforms of pkg into the UPRT locus of PKGI,II-mAID-3HA parasites. dhfr-ts*, Pyrr allele. (B) Coexpression of PKGI,II-mAID-3HA (both green) and PKG-6Ty complementation constructs (red) assessed by IF microscopy. Scale bars = 5 µm. The micrograph rows correspond to the adjacent schematic in panel A. (C) Coexpression of PKGI,II-mAID-3HA (both green) and PKG-6Ty complementation constructs (red) following 4 h of treatment with 500 µM IAA or the vehicle (EtOH) assessed by IF microscopy. Scale bars = 5 µm. (D, E) Plaque formation by parasites treated with 500 µM IAA or the vehicle (EtOH) for 8 days (D) and mean number of plaques formed per well (mock, n = 6; IAA, n = 6) ± the standard deviation from two experiments (E). ****, P < 0.0001; ns, not significant (unpaired two-tailed Student t test). Panels B and C show data from one of at least two experiments with the same outcome.

