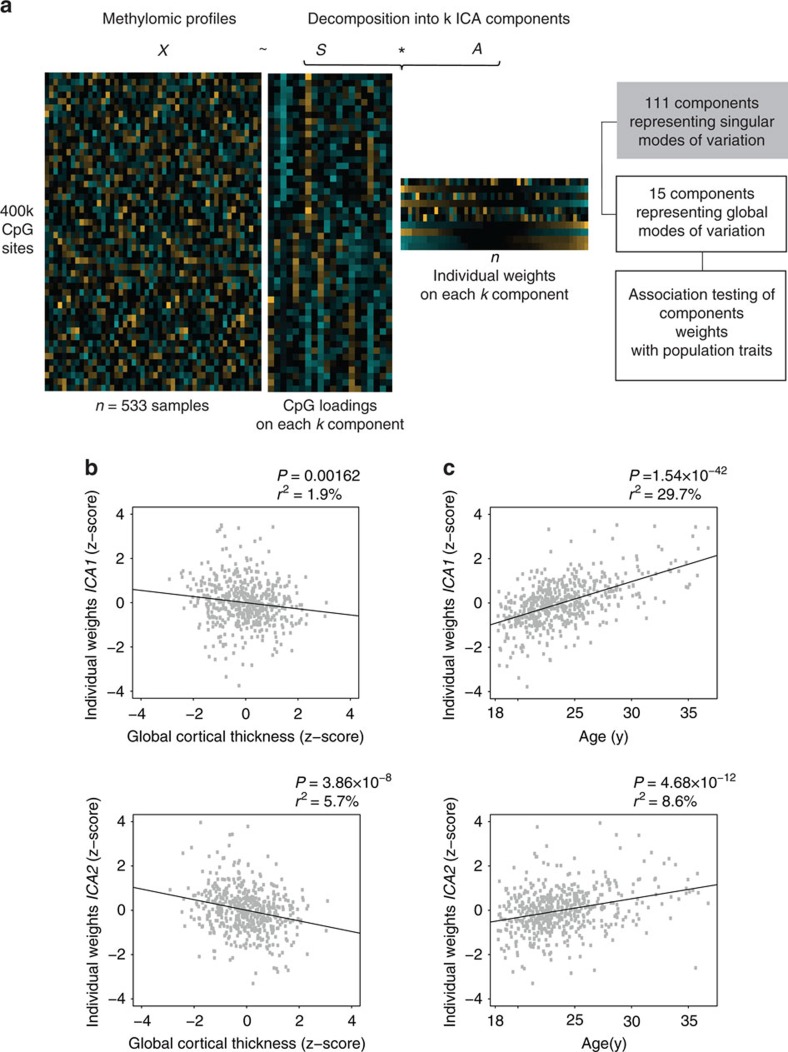
Figure 1. ICA-based identification of DNAm patterns.
(a) Schematic representation of the analysis workflow; ICA decomposition of genome-wide methylomic profiles (matrix X, n=533 samples × 397,947 CpGs sites) into k independent components, simultaneously represented across CpGs (matrix S of CpGs loadings) and samples (matrix A of individual weights). A total of 15 components, whose corresponding weights represent global modes of DNAm across samples, were tested for association with cortical thickness and chronological age. (b) Two components, ICA1 and ICA2, are significantly associated with cortical thickness. Horizontal axis: cortical thickness adjusted for sex, intra-cranial volume and MR-batches. Vertical axis: individual weights on ICA component. (c) ICA1 and ICA2 show significant association with chronological age. P: P value of association (Pearson's correlation, two-sided test); r2: fraction of variance in component weights explained by chronological age (in %).

