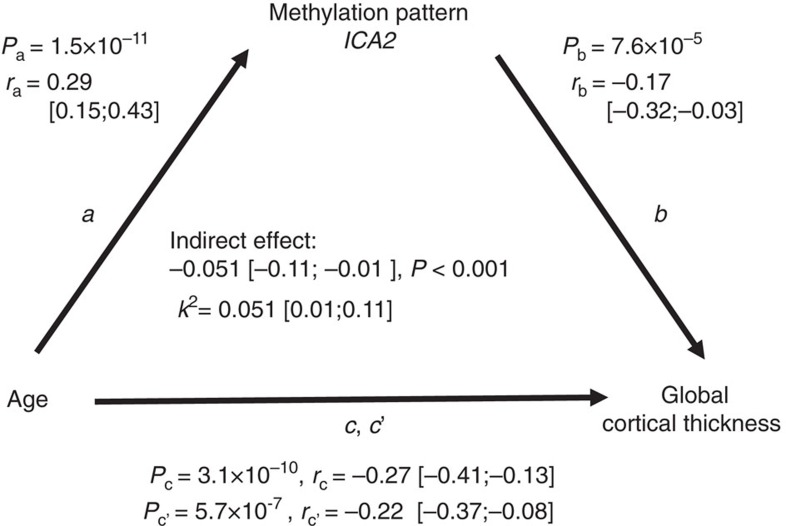
Figure 2. Mediation analysis of methylomic pattern ICA2 on the association between chronological age and global cortical thickness.
Path a represents the effect of chronological age on ICA2. Path b represents the effect of ICA2 on global cortical thickness after removing the effect of chronological age. Path c denotes the total effect of chronological age on global cortical thickness. Path c' represents the direct effect of chronological age on cortical thickness while controlling for the indirect effect (a multiplied by b). r: correlation coefficient; 99.9% confidence interval for the parameters are shown in brackets; P: P value of association. k2: kappa-squared standardized maximum possible mediation effect.

