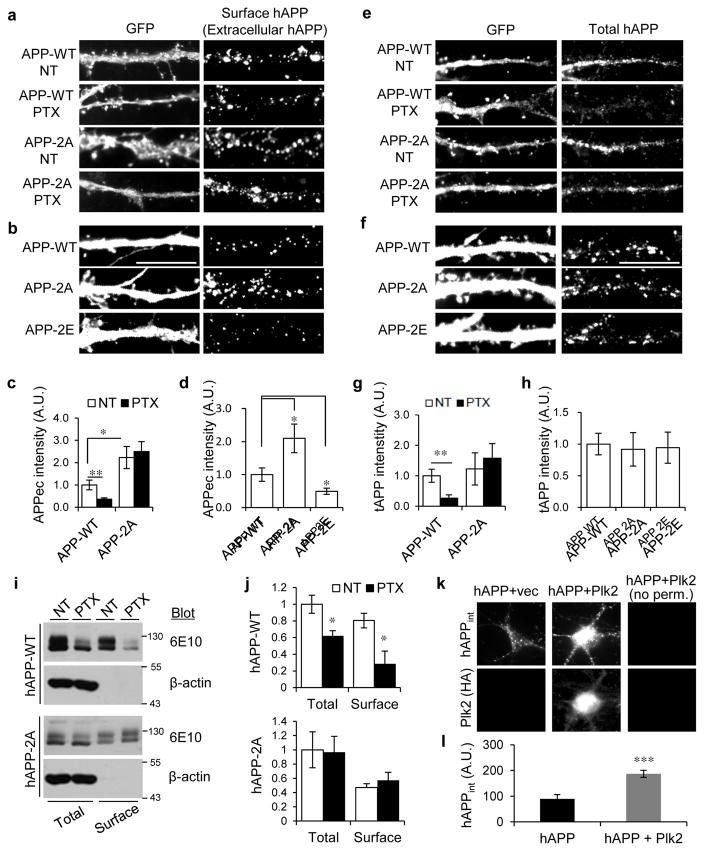
Fig. 6. APP-T668/S675 regulate surface expression and activity-dependent internalization.
(a, b) Hippocampal neurons (21–24 DIV) were co-transfected with GFP and hAPP-WT, −2A, or −2E, and treated with vehicle (NT) or PTX (25 μM, 20 h) as indicated. Surface/extracellular hAPP (APPec) was live-labeled with 6E10 antibody, followed by permeabilization and GFP labeling. (c) Quantification of a (n=15 neurons for APP-WT+NT, 21 for APP-WT+PTX, 9 for APP-2A+NT, 18 for APP-2A+PTX) (d) Quantification of b (n=8 neurons for APP-WT, 9 for APP-2A, 13 for APP-2E). (e, f) Total levels (tAPP) of transfected APP-WT, −2A, or −2E were labeled with human-specific 6E10 antibody along with GFP antibody under permeabilizing conditions. (g) Quantification of e (n=15 neurons for APP-WT+NT, n=8 for APP-WT+PTX, n=7 for APP-2A+NT, and n=10 for APP-2A+PTX). (h) Quantification of f (n=12 neurons for APP-WT, n=11 for APP-2A, and n=7 for APP-2E). (i) Neurons infected with Sindbis-hAPP-WT or −2A were treated with PTX, followed by surface biotinylation. Total and surface hAPP-WT/−2A were immunoblotted with 6E10. (j) Quantification of i (n=3 dishes). Molecular weights in kDa. (k) APP fluorescence internalization assay. Neurons were transfected with hAPP and empty vector or HA-epitope tagged Plk2 as indicated at top and stained for intracellular APP (hAPPint) and cytoplasmic Plk2 as indicated at left. Note the right-most column was left unpermeabilized (no perm.) and showed no staining, demonstrating that all signals are intracellular. (l) Quantification of k (n=14 for hAPP+vector and n=17 for hAPP+Plk2). ***P<0.001, **P<0.01, *P<0.05; ANOVA with Tukey’s post hoc test (except j and l, unpaired Student’s t-test). A.U., arbitrary units. Experiments were performed in at least duplicate unless otherwise noted. Data are means± SEM. Cropped blots are displayed for concise presentation. Full blots are shown in Supplementary Fig. 10.

