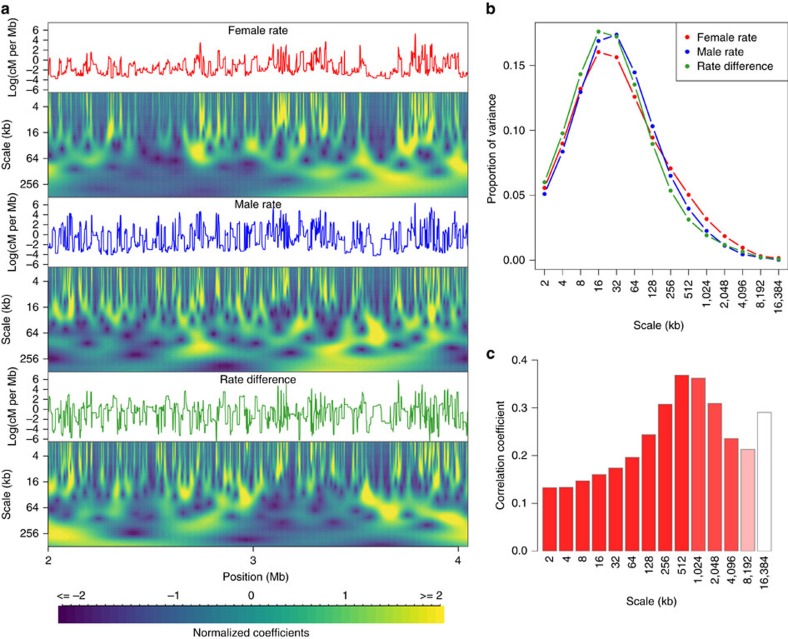
Figure 3. Wavelet analysis of female and male recombination rates.
(a) Continuous wavelet transformation of recombination rates along a 2 Mb region of chromosome 10. Line plots represent the original signal to which the wavelet transform was applied, namely the female (red) and male (blue) log-transformed recombination rates, and the difference between the two (green). Scalograms represent the continuous wavelet transformation (CWT) coefficients for scales from 2 kb up to 512 kb. Colours indicate the magnitude of wavelet coefficients (blue=negative, yellow=positive) at each scale and location, with each level normalized to have equal variance. (b) Genome-wide power spectrum of the female and male recombination rates at scales from 2 to 16,384 kb. (c) Correlation between the detail coefficients of the DWT of female and male recombination rates as a function of scale. The colour of each bar indicates the P value of the correlation, with smaller values shown in darker red shades.

