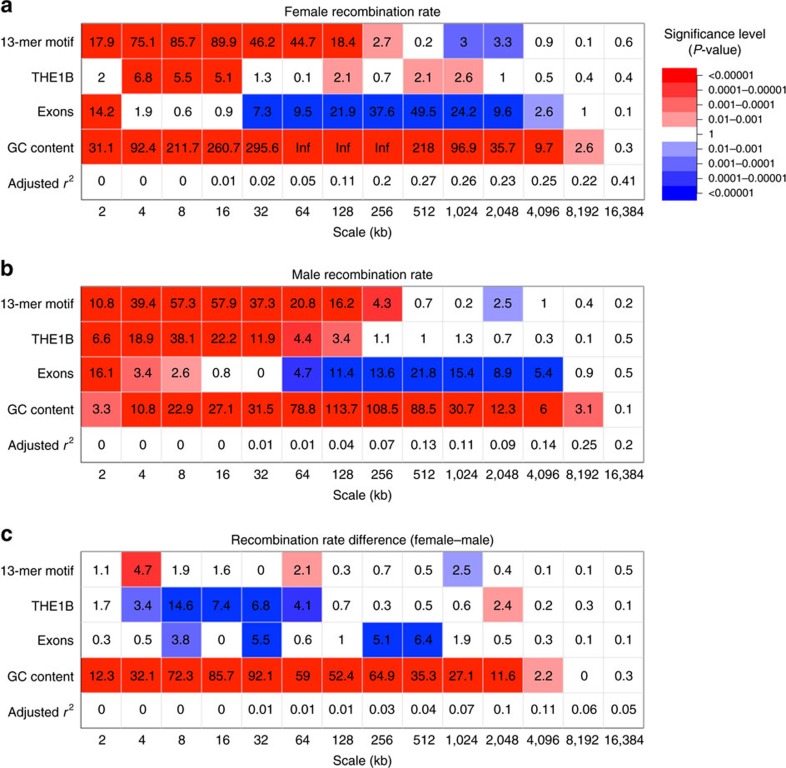
Figure 4. Genomic features associated with the recombination rate.
Wavelet-based linear model of scale-specific genomic correlates to the recombination rate. Table shows the marginal significance (−log10 P-value two-sided t-test) for the linear model analyses of wavelet detail coefficients. Colours indicate the direction of the relationship (red=positive; blue=negative) with intensity proportional to significance. Linear regression analysis was performed on the log-transformed (a) female recombination rate, (b) male recombination rate and (c) on the sex difference between the log-transformed rates (female–male).

