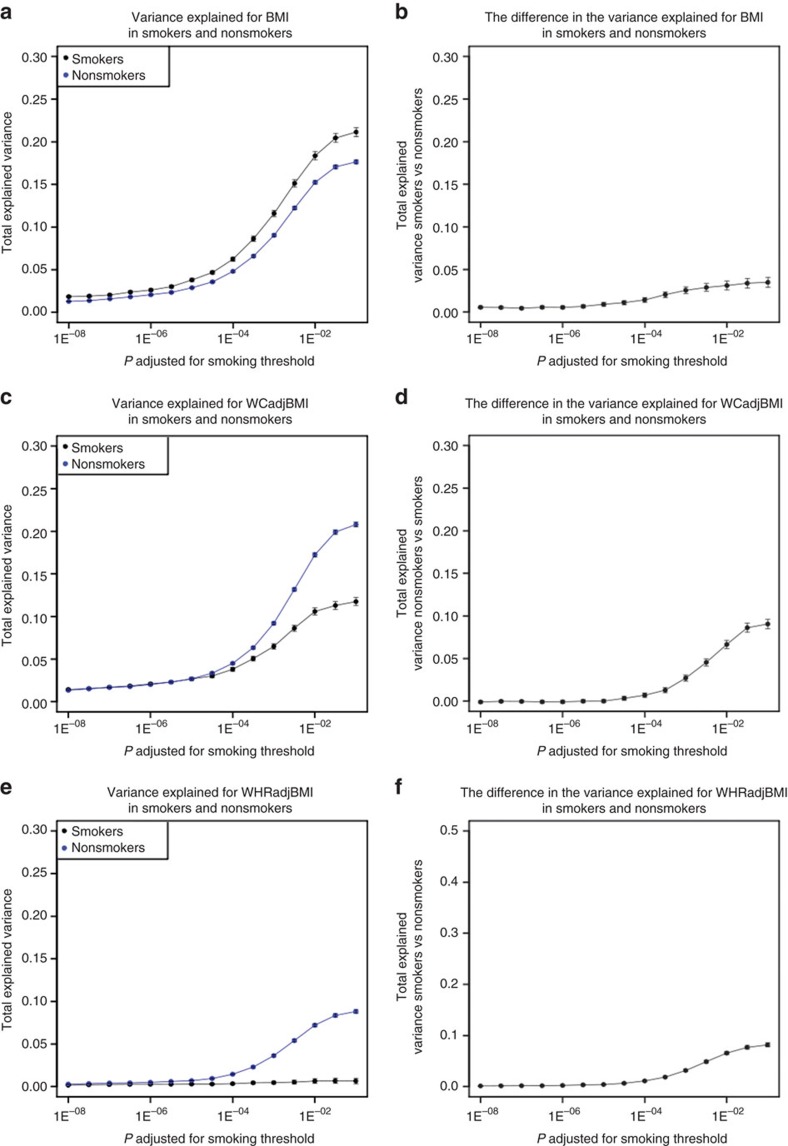
Figure 4. Stratum specific estimates of variance explained.
Total smoking status-specific explained variance (±s.e.) by SNPs meeting varying thresholds of overall association in Approach 1 (SNPadjSMK) and the difference between the proportion of variance explained between smokers and nonsmokers for these same sets of SNPs in BMI (a,b), WCadjBMI (c,d), and for WHRadjBMI (e,f).

