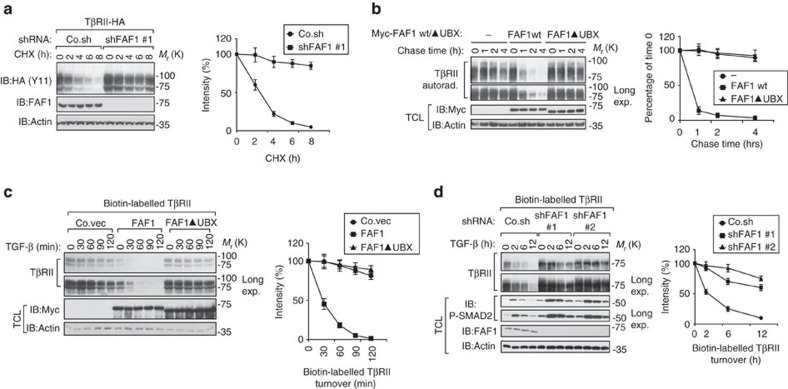
Figure 2. FAF1 promotes TβRII turnover at the cell surface.
(a) The immunoblot (IB) of cell lysate derived from HEK293T cells stably expressing TβRII-HA and depleted of FAF1 that were treated with CHX (20 μg ml−1) at the indicated time points. The amount of protein after CHX treatment was expressed as a percentage of that present before treatment (time 0), and is shown in the right panel. The results are shown as the mean±s.d. of three independent sets of experiments. (b) [35S]-methionine labelling and pulse-chase analysis of TβRII in control and MDA-MB-231 cells stably overexpressing empty vector (−), Myc-FAF1 wt or FAF1▴UBX (UBX domain-deleted mutants). The amount of labeled protein precipitated after the chase was expressed as the percentage of that at the beginning of the chase (time 0) and is shown in the right panel. The results are given as the mean±s.d. of three independent sets of experiments. (c,d) IB of biotinylated cell surface TβRII in MDA-MB-231 cells stably overexpressing FAF1 wt/FAF1 UBX-deleted mutant (▴UBX) (c) or stably depleted of endogenous FAF1 by two independent shRNA (shFAF1 #1 and shFAF1 #2) (d) and treated with TGF-β (5 ng ml−1) at the indicated time points. Quantification of the band intensities is shown in the right panel. Band intensity was normalized to the t=0 controls. The results are presented as the mean±s.d. of three independent sets of experiments.

