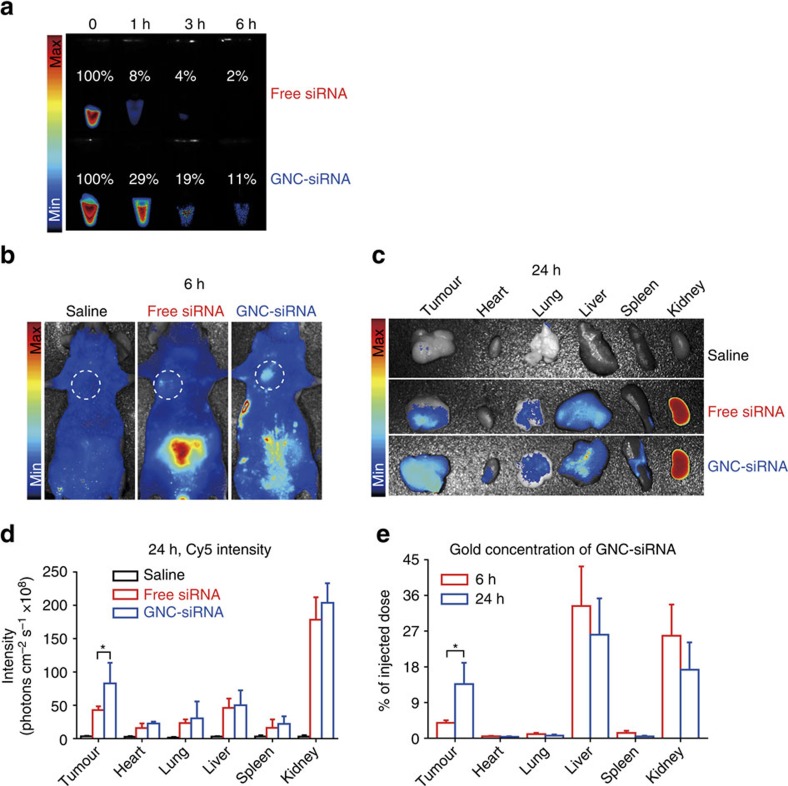
Figure 5. The circulation time and tumour targeting of GNC–siRNA complex in vivo.
(a) The circulation time of free siRNA and GNC–siRNA complex in blood. Cy5 dye-labelled siRNA (Cy5-siRNA) was used for visualization. Blood was drawn from mice after tail vein injection with various Cy5-siRNA formulations (30 μg Cy5-siRNA per mouse equivalent) at different time and imaged under a fluorescence imaging system. The fluorescence intensity of 0 h in each group was normalized as 100%. (b) In vivo tumour targeting. Balb/c nude mice with subcutaneous Panc-1 tumours were injected with different Cy5-siRNA formulations (30 μg Cy5-siRNA per mouse equivalent) via tail vein. After 6 h, fluorescence images of the mice were acquired with in vivo fluorescence imaging system, the white circles indicated the regions of subcutaneous tumours. (c) Tumour targeting by ex vivo imaging. After 24 h of Cy5-siRNA injection, major organs and tumours were isolated from mice for ex vivo fluorescence imaging. (d) The fluorescence intensity of Cy5-siRNA in major organs and tumours at 24 h after intravenous injection. *P<0.01 compared with free siRNA. (e) The concentration of gold in the major organs and tumours (expressed as % of given dose) at 6 and 24 h post injection of GNC–siRNA complex by ICP-MS. Fluorescence images and ICP-MS analysis confirmed the accumulation of GNC–siRNA complex into the tumour sites. Mean±s.d. (n=4). *P<0.01; Student's t-test.

