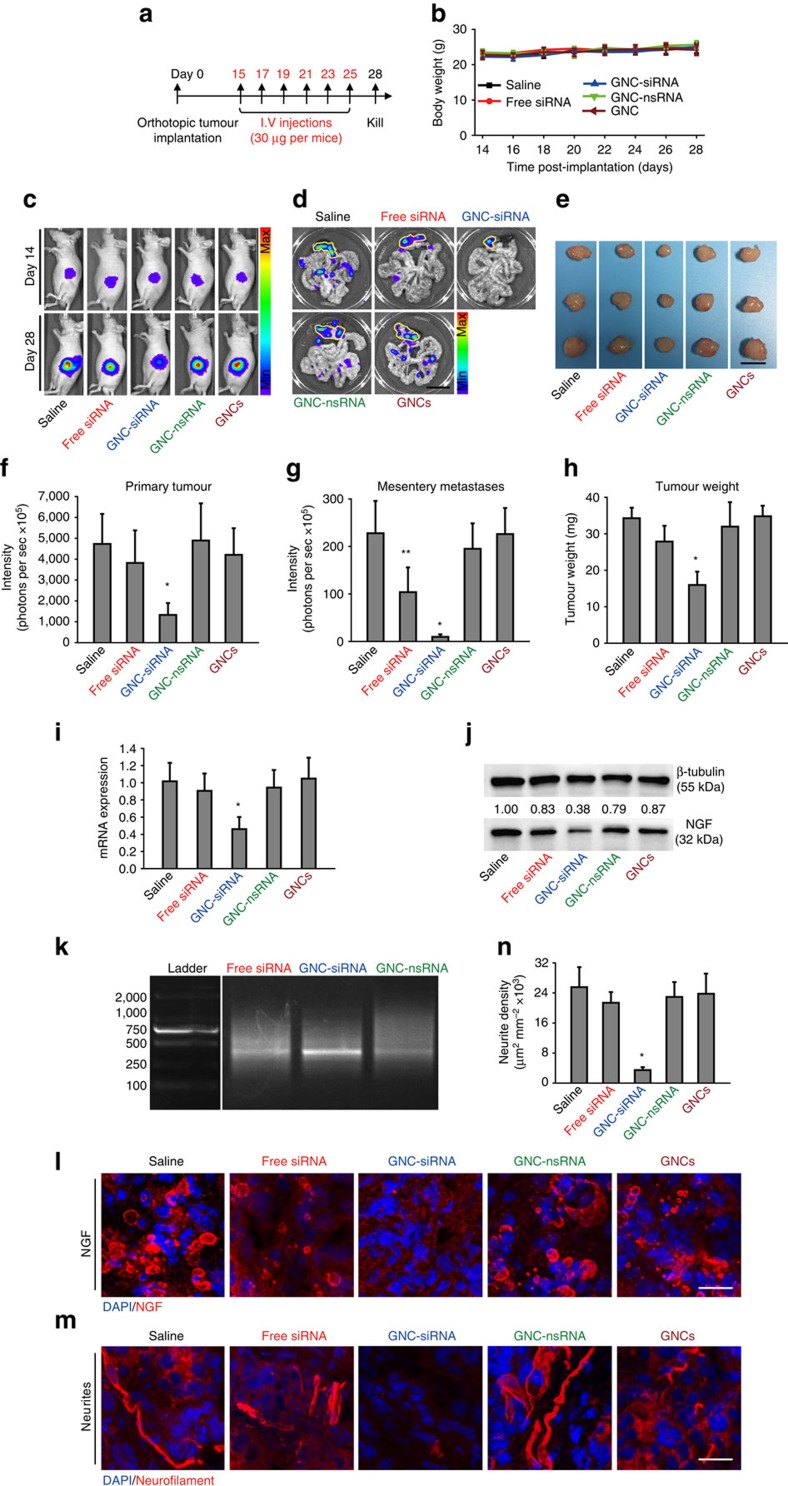
Figure 7. The antitumour and gene knockdown effects of GNC–siRNA complex in orthotopic tumours.
(a) Scheme of siRNA treatment. Panc-1-luc cells were injected into the pancreas head of Balb/c nude mice to form orthotopic tumours. After 2 weeks, mice were divided into different groups. Mice received various formulations via tail veil injections for six times, and killed on day 28. (b) The changes of the mouse body weight during treatments. (c) In vivo whole-body bioluminescence images of mice on day 14 and day 28, which indicated the tumour size before and after siRNA treatment. Bioluminescence signal was a result from the interaction of luciferase from Panc-1-luc cells with D-luciferin injected into the mice before imaging. (d) Ex vivo bioluminescence images of orthotopic pancreatic tumours and tumour metastases into mesenteries on day 28. Yellow lines enclosed the locations of primary tumours in the pancreas. Scale bar, 1 cm. (e) Tumour images on day 28. Scale bar, 5 mm. (f) Quantification of in vivo bioluminescence to evaluate the primary tumours in mice on day 28. (g) Quantification of tumour metastases by the sum of ex vivo bioluminescence detected in the mesenteries on day 28. (h) Weight of the isolated tumours. (i) NGF mRNA and (j) NGF protein expression levels in orthotopic tumours. (k) Confirmation of RNAi-mediated mechanism of action with GNC–siRNA by 5′-RACE assay. A 2% agarose gel electrophotosis showed ∼370 bp RNA-induced silencing complex-mediated cleavage product for NGF siRNA in pancreatic tumours. Only tumours treated with GNC–siRNA complex showed the cleavage product at 370 bp. The left column was the DNA ladder with described molecular weights. (l) IF images of NGF protein (red) in the orthotopic tumours. (m) IF images of neurites (red) in the orthotopic tumours. The cell nuclei were stained with 4,6-diamidino-2-phenylindole (DAPI; blue). Scale bars, 20 μm. (n) Quantification of the neurite density in the orthotopic tumours. Mean±s.d. (n=6–9 per group). Significant difference was from the saline control, *P<0.01, **0.01<P<0.05; Student's t-test.

