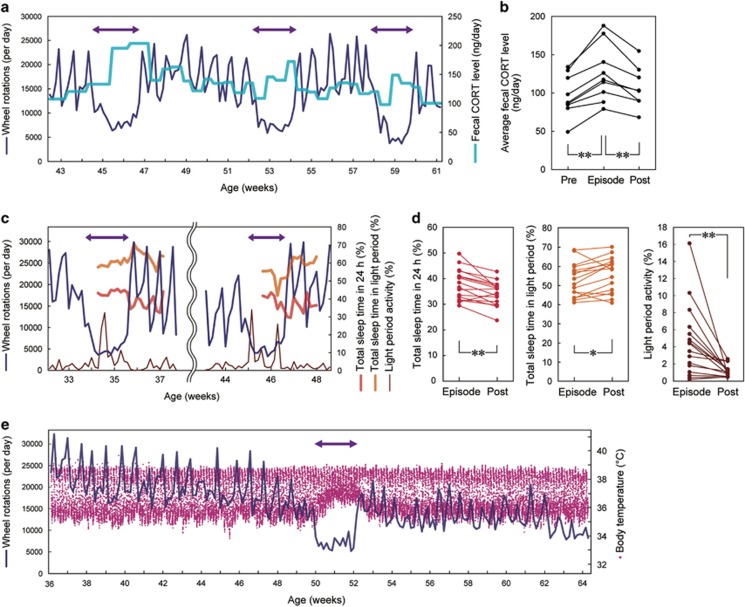
Figure 2.
Physiological analyses of hypoactivity episodes. (a and b) Increased fecal corticosterone level during the episodes. (a) A representative recording. Feces were sampled once or twice a week. (b) Cumulative data for all the episodes analyzed. The average values for 7 days before (‘Pre'), during (‘Episode') and following (‘Post') the hypoactivity episodes are shown, respectively. **P<0.01. (c and d) Sleep disturbance during the episodes; hypersomnia in 24 h, but insomnia in the light period. (c) A representative recording of total sleep time in 24 h and in 12-h light period, as well as wheel-running activity in 12-h light period. (d) Cumulative data for all the episodes analyzed. *P<0.05, **P<0.01. (e) Altered body temperature during the episodes: higher minimal temperature or damped circadian amplitude of body temperature. Core body temperature was measured every 10 min. An image magnified along the temporal axis is shown in Supplementary Figure 3a.

