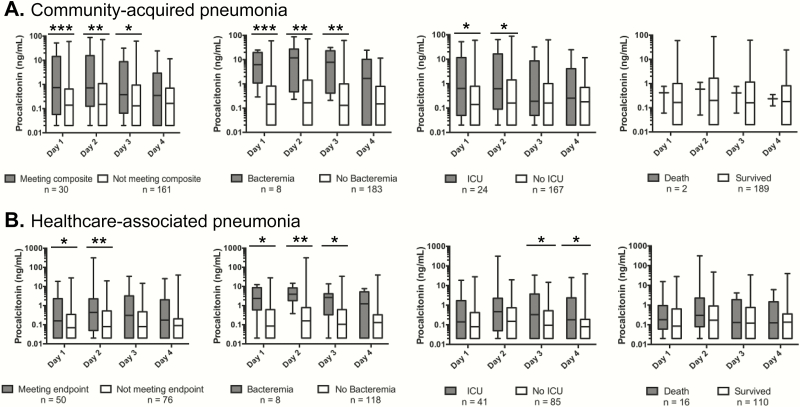
Figure 2.
Box plot representing the range, median, and first through third quartiles of procalcitonin values on hospital days 1 through 4 for patients with community- acquired pneumonia (A) and healthcare-associated pneumonia (B) who met the composite endpoint, developed bacteremia, required intensive care unit (ICU)-level care, or died. *P < .05, **P < .01, ***P < .001.

