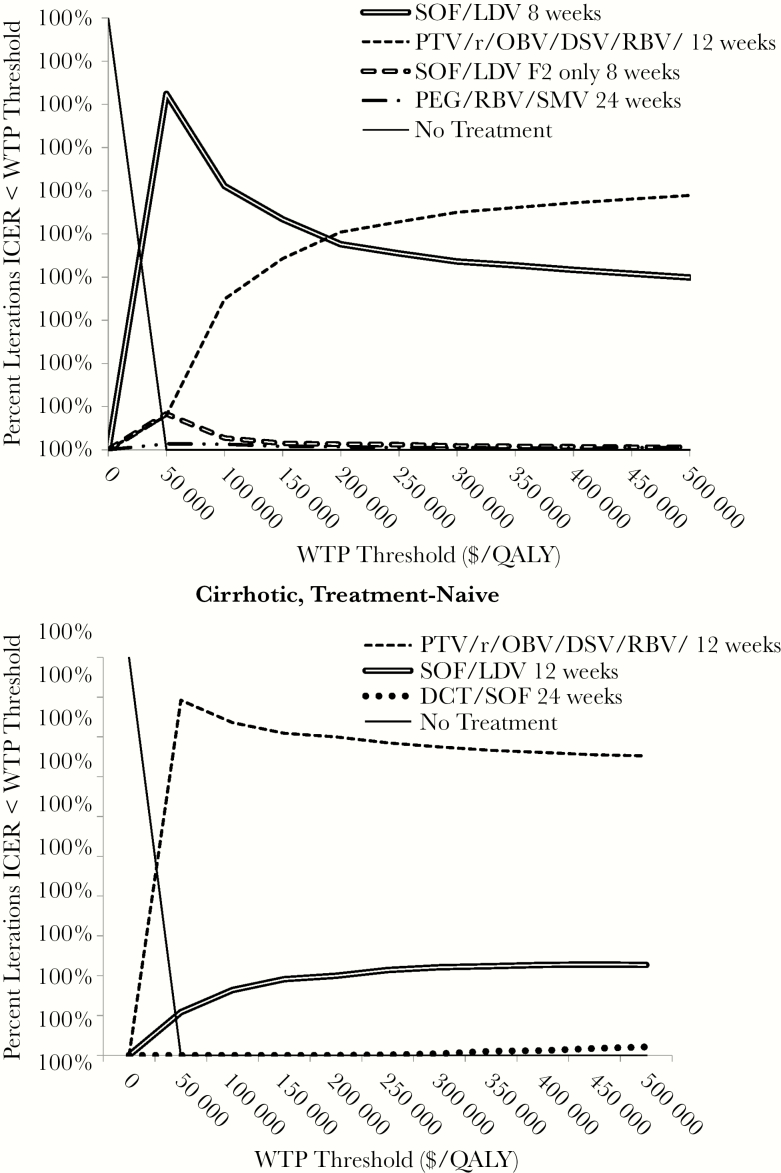
Figure 1.
Cost-effectiveness acceptability curves for the treatment of hepatitis C virus (HCV) genotype 1b patients with and without cirrhosis. Each panel presents the results of probabilistic sensitivity analyses in which we performed multiple iterations of the cost-effectiveness simulation, each time drawing treatment efficacy parameters from defined probability density functions. The horizontal axis represents increasing societal willingness to pay thresholds. Each line represents a treatment strategy. For clarity, we excluded those strategies where the incremental cost-effectiveness ratio (ICER) was above a willingness-to-pay (WTP) threshold of $500 000 in >99% of iterations. The vertical axis depicts the percentage of the simulation iterations in which a given strategy was “preferred” from a cost-effectiveness perspective at a given societal willingness to pay. All costs are in 2014 US dollars and discounted at an annual rate of 3%. DCV, daclatasvir; DSV, dasabuvir; LDV, ledipasvir; OBV, ombitasvir; PTV, paritaprevir; QALY, quality-adjusted life year; r, ritonavir; RBV, ribavirin; SMV, simeprevir; SOF, sofosbuvir.

