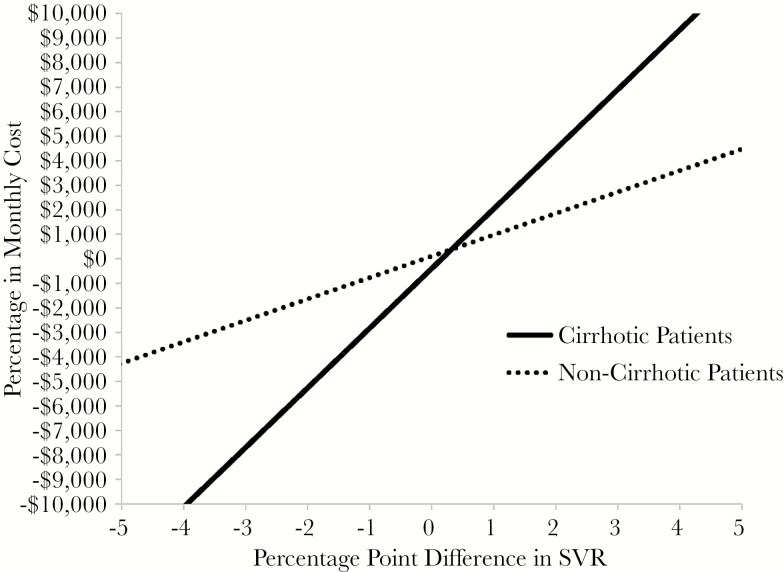
Figure 2.
Two-way sensitivity analysis on interferon-free regimen efficacy and cost. The analysis holds the efficacy and cost of 1 interferon-free treatment (“regimen A”) constant, while varying the efficacy and cost of a competing interferon-free regimen (“regimen B”). To improve generalizability such that the analysis applies to future interferon-free treatment options, we defined the ranges of drug cost and efficacy based on those of current competing drugs, but the analysis is not based on a single regimen. The horizontal axis depicts the relative efficacy of regimen B compared with regimen A. The vertical axis depicts the relative cost. Each line depicts the threshold cost that results in regimen B having an incremental cost-effectiveness ratio (ICER) <$100 000/quality-adjusted life year compared with regimen A at the given relative efficacy. The slope of the line thus represents the economic value of an additional percentage point increase in treatment efficacy. The solid line represents cirrhotic patients, and the dotted line represents noncirrhotic patients. All costs are in 2014 US dollars and discounted at an annual rate of 3%. SVR, sustained virologic response.

