
Fig. 1.
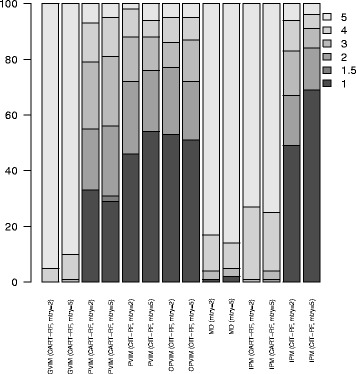
Ranking distribution of X 2 for VIMs in Scenario 1. Barplots with the ranking distribution (in percentage) of X 2. The darker the bar, the greater the importance of X 2 for that method
Official websites use .gov
A
.gov website belongs to an official
government organization in the United States.
Secure .gov websites use HTTPS
A lock (
) or https:// means you've safely
connected to the .gov website. Share sensitive
information only on official, secure websites.
Ranking distribution of X 2 for VIMs in Scenario 1. Barplots with the ranking distribution (in percentage) of X 2. The darker the bar, the greater the importance of X 2 for that method