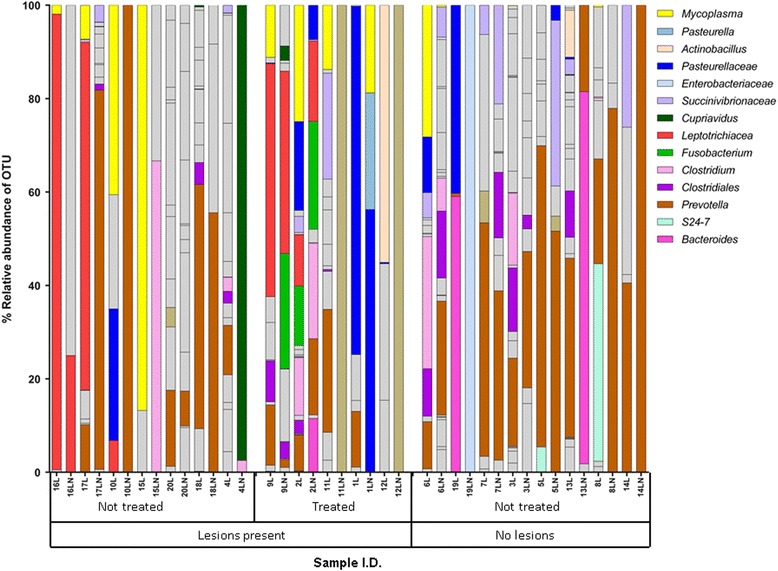
Fig. 3.

Percentage relative abundance of bacteria in post-mortem lung (L) and corresponding lymph node (LN) samples from clinically healthy H-F calves with lung lesions (n = 12) and without lung lesions (n = 8). Adjacent profiles of L and LN are from the same animal. The first seven calves received antibiotic treatment during their lifetimes. Grey bars represent infrequently occurring OTUs (see Additional file 6 for full details of all bacterial OTU classifications)
