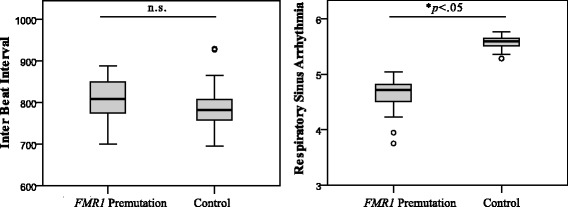
Fig. 1.

Group comparisons on respiratory sinus arrhythmia and inter-beat interval. Note: Figures present model-adjusted values, controlling for age, medication use, and parenting stress level. Untransformed IBI values are depicted for graphical representation. Boxes indicate data between the 25th and 75th percentile, with the horizontal bar reflecting the median (whiskers = the highest and lowest cases within the interquartile range; open circles = outliers, defined as cases falling greater than 1.5 times outside the interquartile range)
