
Fig. 1.
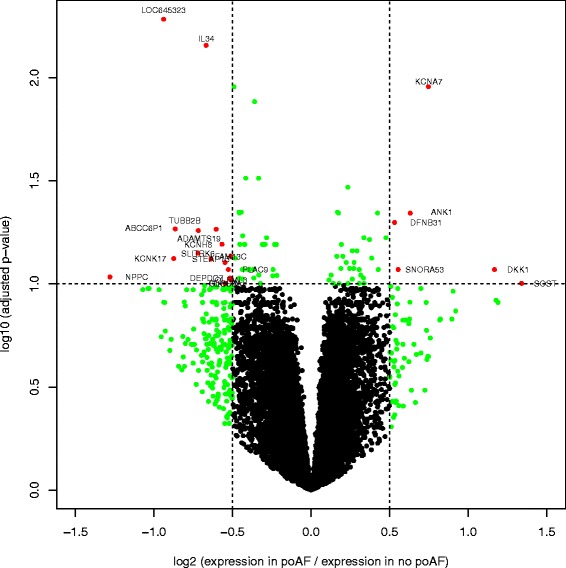
Differentially expressed genes in patients with post-operative atrial fibrillation (poAF). A volcano plot comparing the expression of all genes in the human left atria between patients who had post-operative atrial fibrillation compared to those who did not. The x-axis shows the log2 fold change and the y-axis shows the –log10 of the p-value adjusted for multiple testing. Dotted lines mark predetermined levels of significance; absolute log2 ratio >0.5 (x-axis) or p-value adjusted for multiple testing <0.1 (y-axis). Green dots indicate genes that fulfill one significance criteria, red dost indicate genes that fulfill both