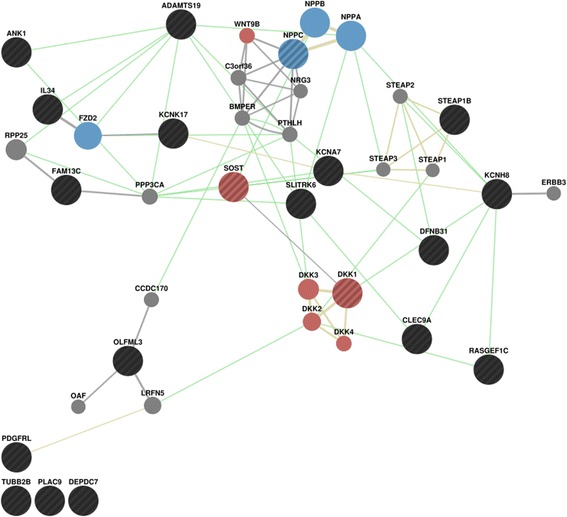
Fig. 3.

Gene Network Analysis. Result of the functional network analysis of the list of genes with differential expression in poAF by the GeneMANIA algorithm [19]. Connections were assessed using the list of differentially expressed genes (black, black stripes) in the context of a left atrial co-expression network (gray connections) and the default GeneMANIA networks on genetic interactions (green) or shared protein domains (yellow). Two gene function categories were overrepresented in the output, the Wnt Signaling pathway (red) and the cGMP metabolic process (blue)
