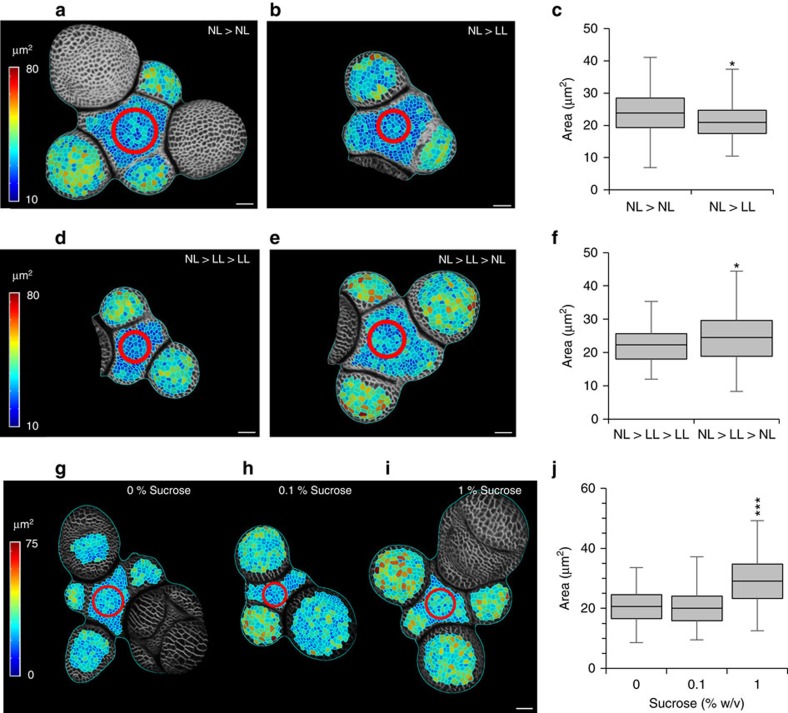
Figure 3. Mean cell size in the SAM is dynamic and dependent on metabolic constraints.
(a,b) Segmented surface projections of stems from plants grown to floral transition under normal light intensity (NL) then either kept under NL conditions (a) or transferred to low light intensity (LL) conditions (b). Shading indicates outer cell surface area. Red circle indicates the region between outgrowing primordia used for quantification. Scale bars represent 20 μm. (c) Distribution of cell sizes under NL>NL and NL>LL. Boxes represent the interquartile range, whiskers represent total range. (Generalized Linear Mixed Model (GLMM), n=348 cells from 12 stems, 6 stems per treatment). (d,e) Segmented surface projections of stems grown under NL>LL conditions then kept in LL (d) or transferred back to NL (e). Shading indicates the outer cell surface area. Red circle indicates the region between outgrowing primordia used for quantification. Scale bars represent 20 μm. (f) Distribution of cell sizes under NL>LL>LL and NL>LL>NL conditions. Boxes represent the interquartile range, whiskers represent total range. (GLMM, n=321 cells from 10 stems, 5 stems per treatment). (g–i) Segmented surface projections of dissected stems from plants grown under NL>LL conditions, then cultured for 72 h growth on media containing 0% (g), 0.1% (h) or 1% sucrose (i). Shading indicates the outer cell surface area. Red circle indicates the region between outgrowing primordia used for quantification. (j) Distribution of cell sizes following 72 h growth on medium containing 0, 0.1 or 1% sucrose. Boxes represent the interquartile range, whiskers represent total range. (GLMM, n=483 cells from 12 stems, 3 stems per treatment). *, **, *** indicate a significance at the 0.05, 0.01 and 0.001 levels respectively.

