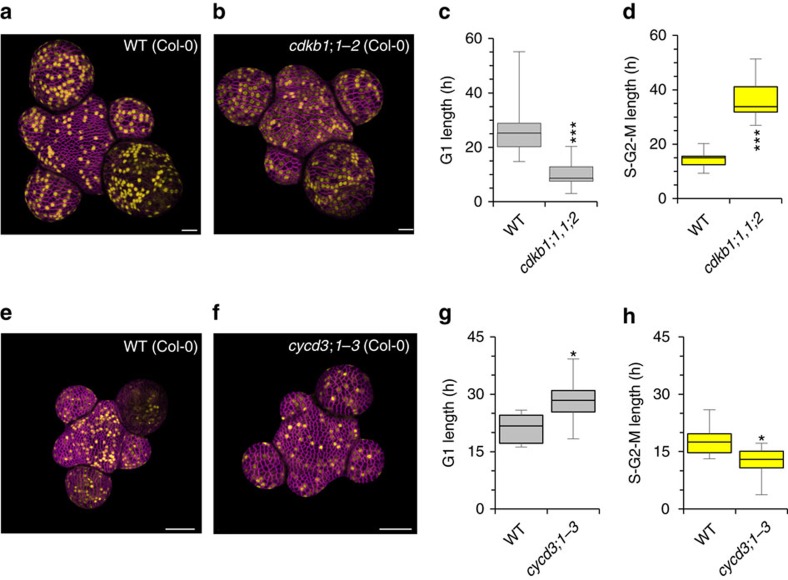
Figure 8. Mutant analysis suggests length of G1 and S-G2-M is size dependent.
(a,b) Surface projections of WT (Col-0) (a) and cdkb1;1/1;2 double mutant plants (b) expressing H4::DB-VENUS. VENUS signal is shown in yellow. Cell membranes are shown in magenta. Scale bars represent 20 μm. (c) Distribution of mean G1 length in WT (Col-0) and cdkb1;1/1;2 plants. Data represent mean values from 13 and 11 plants respectively. (t-test, t=4.6858, df=19.854, P=0.0001) (d) Distribution of mean S-G2-M length in WT (Col-0) and cdkb1;1/1;2 plants. Data represent mean values from 13 and 11 plants respectively. (t-test, t=−4.6858, df=19.854, P=0.0001) (e,f) Surface projections of WT (Col-0) (e) and cycd3;1-3 triple mutant plants (f) expressing H4::DB-VENUS. VENUS signal is shown in yellow. Cell membranes are shown in magenta. Scale bars represent 50 μm. (g) Distribution of mean G1 length in WT (Col-0) and cycd3;1-3 plants. Data represent mean values from 9 and 7 plants respectively. (t-test, t=2.6144, df=9.129, P=0.02775) (h) Distribution of mean S-G2-M length in WT (Col-0) and cycd3;1-3 plants. Data represent mean values from 9 and 7 plants respectively. (t-test, t=−2.6144, df=9.129, P=0.02775) *, **, *** indicate a significance at the 0.05, 0.01 and 0.001 levels respectively. Error bars show total range.

