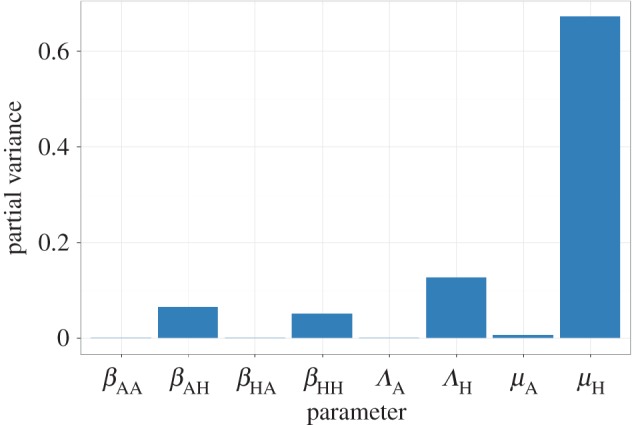
Figure 2.

Results of a global sensitivity analysis on the equilibrium equation showing the partial variance of the individual model parameters. Higher bars indicate greater sensitivity of the model to that parameter. See Material and methods section for details about the sensitivity analysis and parameter ranges used.
