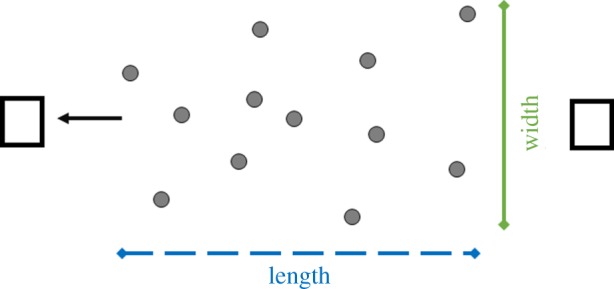
Figure 1.

Diagram of the experimental set-up: the length (blue dashed line) and width (green line) of a group (grey points) in the direction of movement (black arrow) as estimated in our data. The black squares indicate the location of the speakers in relation to the group during each playback.
