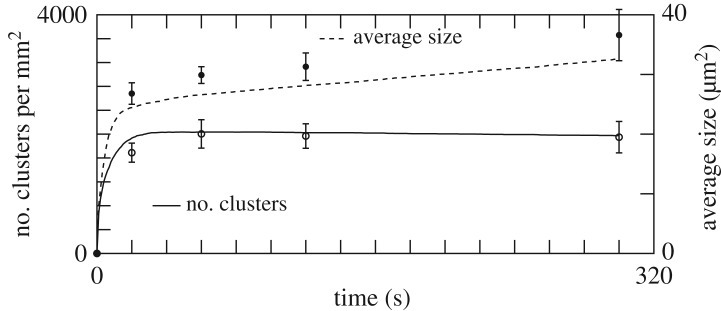
Figure 7.
Same as figure 6, but with padd=120 s−1 and pagg= 14 s−1. The size of the aggregates is very sensitive to this reduction of pagg. The curves describing the time evolution of the number of pre-activated or non-activated platelets are very similar to those of figure 6, and not repeated here.

