
Fig. 2.
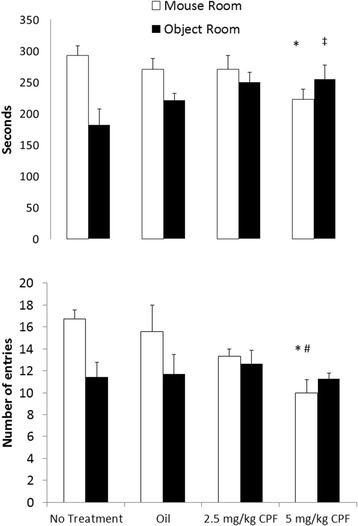
Social preference Mean + SEM time in seconds (top) and number of entries (bottom) into the side containing the novel mouse compared to the side with the inanimate object. * p < .05 compared to the NT and Vehicle groups. The number of mice per group is NT, Vehicle and 5 mg/kg = 7 and 2.5 mg/kg = 3