
Fig. 3.
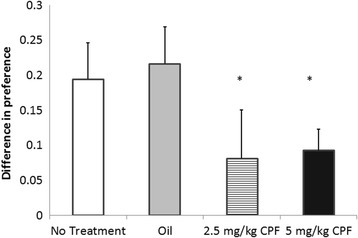
Socially conditioned change in preference for a previously non-preferred bedding (Mean + SEM). * p < .05 compared to the Vehicle group. Number of mice per group was NT = 8; Vehicle = 7; 2.5 mg/kg = 5; 5 mg/kg = 12
Official websites use .gov
A
.gov website belongs to an official
government organization in the United States.
Secure .gov websites use HTTPS
A lock (
) or https:// means you've safely
connected to the .gov website. Share sensitive
information only on official, secure websites.
Socially conditioned change in preference for a previously non-preferred bedding (Mean + SEM). * p < .05 compared to the Vehicle group. Number of mice per group was NT = 8; Vehicle = 7; 2.5 mg/kg = 5; 5 mg/kg = 12