

Abstract
Background
To investigate the influence of region of interest (ROI) size on tumor apparent diffusion coefficient (ADC) measurements in pancreatic cancer.
Methods
The study population consisted of 64 patients with pathologically proved pancreatic ductal adenocarcinomas (PDACs), who underwent preoperative magnetic resonance imaging (MRI) examinations including diffusion-weighted imaging (DWI). The tumor ADCs were measured by two independent readers using six round ROIs with sizes ranging from 20 to 214 mm2 (9 to 97 pixels) in both the six separate measurements. The intra- and inter-observer variabilities were analyzed by using the coefficient of variance (CV), the interclass correlation coefficient (ICC) and Bland-Altman analysis. The mean ADCs measured with the 6 different-sized ROIs were compared using one-way repeated analysis of variance. The sample sizes were calculated by using 80% power and a 5% significance level to detect 10 to 25% changes in ADC measurements.
Results
The largest ROI (ROI214) yielded the best intra-observer repeatability (CV, 6.3%; ICC, 0.93) and inter-observer reproducibility (CV, 10.1%; ICC, 0.84). The mean differences in ADC measurements ± limits of agreement between the two readers were (0.06 ± 0.47) × 10−3 mm2 for ROI20, (0.08 ± 0.46) × 10−3 mm2 for ROI46, (0.05 ± 0.37) × 10−3 mm2 for ROI82, (0.07 ± 0.42) × 10−3 mm2 for ROI115, (0.05 ± 0.43) × 10−3 mm2 for ROI152 and (−0.02 ± 0.29) × 10−3 mm2 for ROI214.
Conclusions
ROI size had a considerable influence on the ADC measurements of PDACs.
Keywords: DWI, ADC, Pancreatic cancer, Region of interest, MRI
Background
Diffusion-weighted imaging (DWI) with quantitative measurement of apparent diffusion coefficient (ADC) values provide an alternative to conventional anatomical magnetic resonance imaging (MRI), such as T1- (T1WI) and T2-weighted imaging (T2WI), for the detection and characterization of pancreatic diseases. Descriptions of DWI techniques and their uses for pancreatic applications can be found in a review article by Barral et al. [1]. Notably, several recent studies focusing on quantitative measurements of ADC based on DWI have indicated that DWI is a valuable tool in the assessment of pancreatic cancer. Lots of studies reported that ADC values in pancreatic cancer were significantly lower compared with benign pancreatic tissue [2–17]. However, there is still a diagnostic challenge to the use of DWI in pancreatic cancer as described by Fukukura et al.,[13] and the reported ranges of ADC values for neoplastic tissues varies dramatically across different studies [2–17]. One reason for this observation is the large variation in the region of interest (ROI) sizes in these studies (ranging from 20 to 789 mm2), which may significantly influence ADC measurements [18, 19]. The avoidance of the placement of smaller ROIs within lesions is commonly recommended, particularly for response assessment studies [1, 20]. There is a clear need for the standardization of ROI sizes for ADC measurements of pancreatic cancers to enable the validation of this quantitative parameter as a qualified biomarker for longitudinal clinical trials. To our knowledge, the effect of ROI size on tumor ADC measurements in pancreatic cancer and the intra- and inter-observer variabilities have never been systematically studied. Thus, the aim of this study was to investigate the influences of ROI size on tumor ADC measurements and intra- and inter-observer variabilities in pancreatic cancer.
Methods
Patients
This single-center retrospective study was reviewed and approved by the ethics committee of our hospital, and informed consent was waived in this study. We undertook a review of our institution’s histopathological database of patients who underwent pancreatic resection between January 2014 and December 2014 and identified 280 consecutive patients who were diagnosed with pancreatic ductal adenocarcinoma (PDAC). Among these patients, 72 patients received preoperative MRI evaluations that included a DWI sequence within two weeks prior to surgery. We excluded 6 patients because the sizes of their tumors were insufficient to clearly indicate the effects of ROI size or draw the defined ROIs on the ADC map. Additionally, 2 other patients were excluded due to the presence of severe motion artifacts in their diffusion-weighted images. Thus, the final study population consisted of 64 patients (41 males; mean age: 61.1 ± 8.7 years; range: 40–78 years). The mean tumor size was 37 ± 9 mm (range, 21–70 mm).
MRI procedure
All of the patients underwent upper abdominal MRI examinations (3.0-T, Signa HDxt, GE, Milwaukee, USA), including respiratory-triggered DWI weighted along three orthogonal gradient directions (b-values, 0 and 600 s/mm2). Fat saturation was performed with selective presaturation with inversion recovery. The main parameters and orders of MRI sequences are summarized in Table 1. Contrast-enhanced T1WI was performed with a gadopentetate dimeglumine injection (contrast media, 0.2–0.3 ml/kg; physiological saline, 10–15 ml).
Table 1.
Parameters for MRI
| Sequence | TR/TE (ms) | FOV (mm) | Matrix | Thickness/gap (mm) | Flip angle (°) | Slices | NEX | Bandwidth (kHz) | Speed factor |
|---|---|---|---|---|---|---|---|---|---|
| MRCP | 7000/1253.4 | 300 × 300 | 288 × 288 | 64/0 | - | 6 | 0.92 | 31.2 | - |
| T2WI | 6316/73.8 | 360 ~ 400 | 320 × 192 | 5/1 | 90 | 20 | 2 | 83.3 | 2 |
| DWI | 6000/58.6 | 380 × 304 | 128 × 96 | 5/1 | 90 | 20 | 2/4a | 250 | 2 |
| T1WI | 2.5/1.1 | 440 × 418 | 256 × 180 | 2.5/0 | 11 | 84 | 0.70 | 125 | 2 |
aNEX = 2 for DWI at b0, NEX = 4 for DWI at b600
MRCP magnetic resonance cholangiopancreatography, T2WI T2-weighted imaging, DWI diffusing weighted imaging, T1WI T1-weighted imaging
Data analysis
Based on the DWI images with b values of 0 and 600 s/mm2, ADC maps were calculated using a monoexponential model (ADC = (ln (SIb0/SIb600))/600) on a workstation (Function V9.4.05, AW 4.4, GE Healthcare). The ADC maps were reconstructed automatically with a 380 × 380 mm2 field of view (FOV) and a 256 × 256 matrix. The anonymous MR images of patients were sorted in a random order. The MRI data were evaluated and analyzed using ImageJ software (v1.47; http://rsb.info.nih.gov/ij). Six round ROIs (areas: 20, 46, 82, 115, 152, and 214 mm2; pixel numbers: 9, 21, 37, 52, 69, and 97) were drawn on the solid part of the tumor as identified on contrast enhanced T1WI (Fig. 1) while avoiding cystic lesion, dilated pancreatic ducts, and necrosis by referring to T2WI or T1WI images in both the six separate measurements. The mean ADC value and its standard deviation (SD) within each recorded ROI were obtained. All of the ADC values of the PDAC were independently measured by two observers (with 11 and 6 years of experience in abdominal radiology). To evaluate the intra-reader variability, the tumors ADCs were measured twice by reader 1 with an interval greater than three weeks. The first measurements of the tumor ADCs from reader 1 were further used to evaluate the inter-observer variability of the ADC values.
Fig. 1.
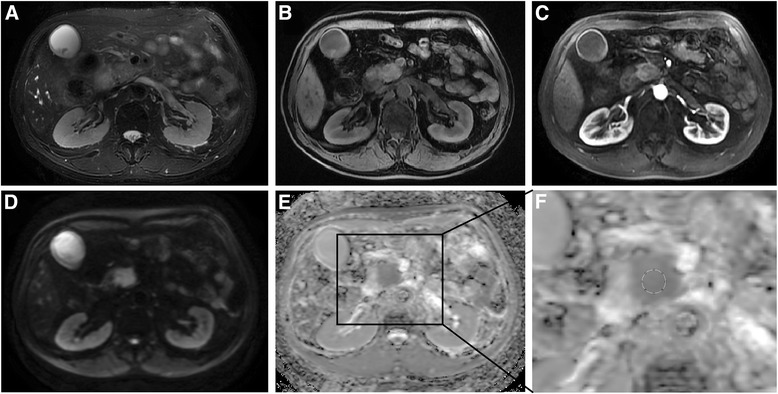
MRI images of histological proven pancreatic cancer in 64-year-old man. a: Axial T2WI; b: Axial precontrast T1WI; c: Axial contrast-enhanced arterial phase T1WI demonstrating the hypovascularity of the mass; d: DWI image (b = 600 s/mm2); e: ADC map; f: zoomed-in ADC map that indicates a ROI with a size of 214 mm2 (pixel number: 97) was used to measure the tumor ADC values
Statistical analysis
SPSS (v16.0, SPSS Inc., Chicago, IL, USA) was used for the statistical analyses. Normality assumptions were assessed using the Shapiro-Wilk’s test. The intra- and inter-observer variabilities of tumor ADC measurements were evaluated with the interclass correlation coefficient (ICC) and Bland-Altman analysis [21, 22]. The measurement errors between the intra- and inter-observer measurements were quantified with the coefficient of variance (CV). Based on a two-sample unpaired t-test (80% power and a 5% significance level) [23, 24], the sample sizes needed to detect 10 to 25% changes in the ADC measurements for each ROI size were calculated. The homogeneity indices (defined by the SD/mean ADC within each recorded ROI) were also calculated for the tumors at each ROI size. The mean ADCs obtained from the 6 different-sized ROIs were compared by one-way repeated analysis of variance (ANOVA). P < 0.05 was established as the threshold for significance of the statistical analyses.
Results
Typical MRI images and the ADC maps used for the ADC measurements are demonstrated in Fig. 1. As illustrated in Table 2, no significant difference was observed in the mean ADCs among the 6 different-sized ROIs for all the three measurements of two observers (all P > 0.05). Box plots providing graphic illustrations of the study data are presented in Fig. 2. The homogeneity index increased with increasing ROI size (Table 2).
Table 2.
Mean ADC values (×10−3 mm2/s) and standard deviations (SDs) within each recorded ROI and the homogeneity indices (HI, calculated as the SD/mean ADC of each recorded ROI) of the pancreatic adenocarcinomas obtained with the 6 different-sized ROIs by two independent readers
| ROI20 | ROI46 | ROI82 | ROI115 | ROI152 | ROI214 | P-value1 | |||||||
|---|---|---|---|---|---|---|---|---|---|---|---|---|---|
| ADC | HI | ADC | HI | ADC | HI | ADC | HI | ADC | HI | ADC | HI | ||
| Reader 1 (1st) | 1.46 ± 0.28 | 0.07 ± 0.04 | 1.46 ± 0.27 | 0.11 ± 0.11 | 1.45 ± 0.27 | 0.12 ± 0.08 | 1.48 ± 0.26 | 0.13 ± 0.10 | 1.45 ± 0.26 | 0.14 ± 0.10 | 1.49 ± 0.25 | 0.15 ± 0.08 | 0.40 |
| Reader 1 (2nd) | 1.45 ± 0.28 | 0.07 ± 0.06 | 1.49 ± 0.25 | 0.09 ± 0.07 | 1.49 ± 0.26 | 0.10 ± 0.06 | 1.48 ± 0.26 | 0.12 ± 0.09 | 1.48 ± 0.25 | 0.13 ± 0.10 | 1.46 ± 0.26 | 0.14 ± 0.09 | 0.39 |
| Reader 2 | 1.52 ± 0.27 | 0.06 ± 0.03 | 1.54 ± 0.25 | 0.08 ± 0.06 | 1.51 ± 0.26 | 0.10 ± 0.06 | 1.54 ± 0.29 | 0.12 ± 0.07 | 1.51 ± 0.27 | 0.13 ± 0.07 | 1.46 ± 0.28 | 0.15 ± 0.10 | 0.09 |
The data are summarized as mean ± SD; ROI region of interest, ADC Apparent diffusion coefficient, HI Homogeneity index
1One way repeated ANOVA of the mean ADC values from the 6 different-sized ROIs. Reader 1 (1st) and Reader 1 (2nd) represent the first and second measurements of the tumor ADCs from reader 1, respectively
Fig. 2.
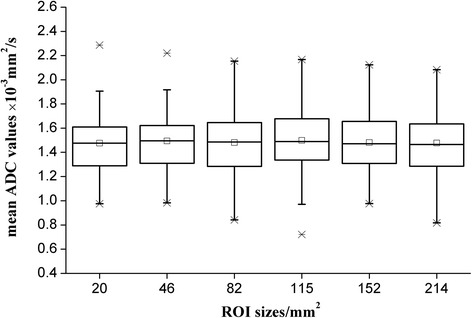
Box plots of the mean ADCs measured by the two readers with 6 round ROIs of sizes ranging from 20 to 214 mm2. The midline within each box represents the median value. The solid dot within each box represents the mean value. The crosses above and below each box indicate the minimum and maximum values, respectively
Intra-observer variability of ADC values
The bias, limit of agreement (LOA) and ICC values are summarized in Table 3. Good or excellent agreements (ICC > 0.78) were found for various ADC measurements with ROI20 (i.e. a ROI with an area of 20 mm2) to ROI214 between the two measurements from reader 1 (Table 3). The mean ADCs were more scattered with decreasing ROI sizes.
Table 3.
Intra-observer reproducibility analysis of two repeated measurements of ADC by the same reader
| Mean ADC ± SD (×10−3 mm2/s) | CV | Bias | LOA | ICC | |
|---|---|---|---|---|---|
| ROI20 | 1.45 ± 0.16 | 10.9% | −0.01 | [−0.32, 0.30] | 0.84 |
| ROI46 | 1.47 ± 0.17 | 11.7% | 0.03 | [−0.31, 0.37] | 0.78 |
| ROI82 | 1.47 ± 0.13 | 9.1% | 0.03 | [−0.23, 0.30] | 0.87 |
| ROI115 | 1.48 ± 0.15 | 10.2% | <0.01 | [−0.30, 0.29] | 0.83 |
| ROI152 | 1.47 ± 0.09 | 6.4% | 0.02 | [−0.16, 0.21] | 0.93 |
| ROI214 | 1.48 ± 0.09 | 6.3% | <0.01 | [−0.19, 0.18] | 0.93 |
SD standard deviation, CV coefficient of variance, LOA limit of agreement, ICC intra-class coefficient
Inter-observer variability of ADC values
The bias, limit of agreement (LOA) and ICC values for the inter-observer comparison are summarized in Table 4. Similar to the intra-observer findings, the mean ADCs were more scattered with decreasing ROI sizes. The ICCs demonstrated moderate to excellent agreements from ROI20 to ROI214 between the ADC measurements from the two readers (ICCs, 0.59–0.84), and excellent agreement was only found for the ADC measurements with ROI214 between the two readers (ICC, 0.84; Table 4). The inter-observer agreements in the ADC measurements for each ROI were worse (i.e. smaller ICCs) than the intra-observer agreements.
Table 4.
Inter-observer reproducibility of the two repeated measurements of ADC by two independent readers
| Mean ADC ± SD (×10−3 mm2/s) | CV | Bias | LOA | ICC | |
|---|---|---|---|---|---|
| ROI20 | 1.49 ± 0.24 | 15.9% | 0.06 | [−0.40, 0.53] | 0.63 |
| ROI46 | 1.50 ± 0.24 | 15.7% | 0.08 | [−0.38, 0.54] | 0.59 |
| ROI82 | 1.48 ± 0.19 | 12.6% | 0.05 | [−0.31, 0.42] | 0.76 |
| ROI115 | 1.51 ± 0.21 | 14.0% | 0.07 | [−0.35, 0.48] | 0.70 |
| ROI152 | 1.48 ± 0.22 | 14.6% | 0.05 | [−0.37, 0.48] | 0.66 |
| ROI214 | 1.47 ± 0.15 | 10.1% | −0.02 | [−0.31, 0.27] | 0.84 |
SD standard deviation, CV coefficient of variance, LOA limit of agreement, ICC intra-class coefficient
Sample size calculation
The sample size calculations for detecting 10 to 25% changes in the ADC values for the 6 sizes of ROIs are summarized in Table 5. The use of the largest ROI (214 mm2) for ADC measurements of PDACs as the end point required the smallest sample size, and the smaller ROIs required 56 to 150% more patients to detect similar changes.
Table 5.
Sample size calculations for the 6 different-sized ROIs to detect 10 to 25% changes in ADC values
| CV (inter-observer) | 10% | 15% | 20% | 25% | |
|---|---|---|---|---|---|
| ROI20 | 15.9% | 80 | 36 | 20 | 13 |
| ROI46 | 15.7% | 78 | 35 | 19 | 12 |
| ROI82 | 12.6% | 50 | 22 | 13 | 8 |
| ROI115 | 14.0% | 62 | 28 | 15 | 10 |
| ROI152 | 14.6% | 67 | 30 | 17 | 11 |
| ROI214 | 10.1% | 32 | 14 | 8 | 5 |
CV coefficient of variance
Discussion
ADC measurements have been utilized to investigate pancreatic adenocarcinomas; nevertheless, few studies have investigated the effect of ROI size on the reliability of ADC measurements in PDACs. In prior studies, ROI sizes for ADC measurements of PDACs have greatly varied [3, 4, 11–13, 17], and although no formal recommendations exist, a minimum size of 100 mm2 is commonly used [1]. ANOVA results show that the mean ADCs of tumors are independent of the ROI size in PDAC patients; however, ROI sizes have considerable influence on the intra- and inter-observer variabilities of ADC measurements of PDAC, regarding the inter-observer comparisons of the ADC values for the 6 ROIs, only the reproducibility of the mean ADC of the PDACs obtained from ROI214 was acceptable because the mean intra-observer biases of the ADC measurements did not exceed ± 0.10 × 10⁻³ mm2/s and the limit of agreement was less than ± 0.30 × 10⁻³ mm2/s (Tables 3 and 4) [23]. Additionally, excellent agreement between the two readers was found only in the ADC measurements from ROI214 (ICC, 0.84; Table 4). Compared with ROI214, ROI115 exhibited a 39% larger CV, and required 92% more patients to detect similar ADC changes in clinical trials.
We also found that the heterogeneities of the PDACs were evident and increased with larger ROIs. The homogeneity index was over 0.10 when the ROI size was larger than 82 mm2 (Table 2). Such heterogeneities led to measurement errors in the ADC values when small ROIs were used. It is noting, this study firstly assesses the influence of ROI size on the ADC measurements and intra- and inter-observer variabilities associated with PDAC and to provide sample size calculations for longitudinal studies.
Three ROI methods, including the whole-volume ROI [19, 25, 26], single-slice ROI [8, 10] and small solid-sample ROI [11–17] approaches have been used to obtain ADC measurements from tumors. In our previous studies, we found that despite its larger inter-observer variability [25], small solid-sample ROIs on tumors provide greater diagnostic performance in the assessment of PDAC compared with single-slice and whole-volume ROI methods [27],. In addition, it is difficult to perform ADC measurements with whole-volume or single-slice ROI method in many tumors of patients with PDAC because of the unclear boundaries of tumors on DWI images [13, 17, 25]. Solid-sample ROI is the most commonly used approach for ADC measurements of PDAC [2–7, 11–17]. The ROIs in the lesions are delineated to avoid pancreatic ducts, cystic lesions, and imaging artifacts. Therefore, the small solid-sample ROI approach was used in this study.
In addition to ROI methods, imaging acquisition parameters, including the field strength, respiratory compensation method, number of b values used, maximum b value selected, and post-processing approach, may influence tumor ADC measurements [28]. In our study, the DWI examinations were performed with a respiratory-triggered DWI sequence on a 3.0-T scanner in a single hospital, and thus bias produced by the use of different MRI machines or sequences was avoided. Kartalis et al. suggested that respiratory-triggered DWI is the recommended method for imaging a PDAC [29]. Additionally, the calculations of \ADC maps, based on DW images of b0 and b600, which were selected to balance the image contrast and signal-to-noise ratio for pancreas, were performed by using a monoexponential model. Numerous DWI studies using similar b values for imaging pancreatic diseases [8, 10–12, 30–32]. Moreover, Koc Z and Erbay G reported that 600 s/mm2 is the optimal b-value for differentiation of abdominal lesions [15].
Our study had several limitations. First, longitudinal data are not available and the effect of ROI size on therapy response evaluation has not yet been investigated. Future larger scale longitudinal studies are required to confirm our results. Second, all of the examined lesions were pancreatic adenocarcinomas, and no other pathological pancreatic conditions were included in this study. Third, we enrolled patients who had undergone MRI examinations that were performed on the same 3.0-T system. This scenario may be ideal. The sample sizes acquired would likely increase in a multi-center taril using variable scanners due to greater CVs [33]. Finally, the effects of field strengths and selection of b-values on the ADC measurements were not evaluated; thus, field strengths and the selection of b-values may affect our results.
Conclusions
This focused DWI study demonstrated that ROI size had a considerable influence on the ADC measurements of PDACs at 3.0-T. A large ROI size reduces the intra- and inter-observer variabilities in ADC measurements. A ROI size of 214 mm2 or greater will require a small sample size for future clinical trials.
Acknowledgements
Not applicable.
Funding
Supported by Grants from the Natural Science Foundation of Shanghai (14ZR1408300), medical guidance project of Shanghai Municipal Science and Technology Commission (14411960100).
Availability of data and materials
Please contact author for data requests.
Authors’ contributions
Ma C, Li J, Wang L, Zhang J, Fang X, Shao C, and Lu J performed the majority of experiments, made substantial contributions to the data analysis and interpretation, and wrote the manuscript draft; Guo X, Liu L, Zhan Q, Zhu C, Qu J and Chen S participated in the design of the study and made substantial contribution to data analysis; Wang L made substantial contributions to the study conception and design, critically revised the manuscript draft for important intellectual content, and gave final approval of the version to be published; all the authors read and approved the final manuscript.
Competing interests
The authors declare that they have no competing interests.
Consent for publication
Not applicable.
Ethics approval and consent to participate
This study was approved by our Institutional Review Board (Shanghai Changhai Hosptial Ethics committee). Informed consent was waived in this retrospective study.
Publisher’s Note
Springer Nature remains neutral with regard to jurisdictional claims in published maps and institutional affiliations.
Abbreviations
- ADC
Apparent diffusion coefficient
- ANOVA
One-way repeated analysis of variance
- Coefficient
Coefficient of variance
- DWI
Diffusion-weighted imaging
- FOV
Field of view
- ICC
Interclass correlation CV
- IQR
Interquartile range
- LOA
Limit of agreement
- MRI
Magnetic resonance imaging
- PDAC
Pancreatic ductal adenocarcinomas
- ROI
Region of interest
- SD
Standard deviation
- T1WI
T1-weighted imaging
- T2WI
T2-weighted imaging
Contributor Information
Chao Ma, Email: mengqihi@gmail.com.
Xiaoyu Guo, Email: 18988230@qq.com.
Li Liu, Email: liu_liuli@hotmail.com.
Qian Zhan, Email: zhangqian@aliyun.com.
Jing Li, Email: lijing_hao358@163.com.
Chengcheng Zhu, Email: Chengcheng.Zhu@ucsf.edu.
Li Wang, Phone: +86 21 31162147, Email: wangli_changhai@163.com.
Jing Zhang, Email: zhangjing@smmu.edu.cn.
Xu Fang, Email: 379671722@qq.com.
Jianxun Qu, Email: jianxun.qu@ge.com.
Shiyue Chen, Email: shiyuechen@126.com.
Chengwei Shao, Email: shaochengweich@126.com.
Jian-ping Lu, Email: cjr.lujianping@vip.163.com.
References
- 1.Barral M, Taouli B, Guiu B, Koh DM, Luciani A, Manfredi R, et al. Diffusion-weighted MR imaging of the pancreas: current status and recommendations. Radiology. 2015;274:45–63. doi: 10.1148/radiol.14130778. [DOI] [PubMed] [Google Scholar]
- 2.Matsuki M, Inada Y, Nakai G, Tatsugami F, Tanikake M, Narabayashi I, et al. Diffusion-weighed MR imaging of pancreatic carcinoma. Abdom Imaging. 2007;32:481–483. doi: 10.1007/s00261-007-9192-6. [DOI] [PubMed] [Google Scholar]
- 3.Park MJ, Kim YK, Choi SY, Rhim H, Lee WJ, Choi D. Preoperative detection of small pancreatic carcinoma: value of adding diffusion-weighted imaging to conventional MR imaging for improving confidence level. Radiology. 2014;273:433–443. doi: 10.1148/radiol.14132563. [DOI] [PubMed] [Google Scholar]
- 4.Wiggermann P, Grützmann R, Weissenböck A, Kamusella P, Dittert DD, Stroszczynski C. Apparent diffusion coefficient measurements of the pancreas, pancreas carcinoma, and mass-forming focal pancreatitis. Acta Radiol. 2012;53:135–139. doi: 10.1258/ar.2011.100252. [DOI] [PubMed] [Google Scholar]
- 5.Wang Y, Miller FH, Chen ZE, Merrick L, Mortele KJ, Hoff FL, et al. Diffusion-weighted MR imaging of solid and cystic lesions of the pancreas. Radiographics. 2011;31:E47–64. doi: 10.1148/rg.313105174. [DOI] [PubMed] [Google Scholar]
- 6.Lee SS, Byun JH, Park BJ, Park SH, Kim N, Park B, et al. Quantitative analysis of diffusion-weighted magnetic resonance imaging of the pancreas: usefulness in characterizing solid pancreatic masses. J Magn Reson Imaging. 2008;28:928–936. doi: 10.1002/jmri.21508. [DOI] [PubMed] [Google Scholar]
- 7.Lemke A, Laun FB, Klauss M, Re TJ, Simon D, Delorme S, et al. Differentiation of pancreas carcinoma from healthy pancreatic tissue using multiple b-values: comparison of apparent diffusion coefficient and intravoxel incoherent motion derived parameters. Invest Radiol. 2009;44:769–775. doi: 10.1097/RLI.0b013e3181b62271. [DOI] [PubMed] [Google Scholar]
- 8.Rosenkrantz AB, Matza BW, Sabach A, Hajdu CH, Hindman N. Pancreatic cancer: Lack of association between apparent diffusion coefficient values and adverse pathological features. Clin Radiol. 2013;68:e191–197. doi: 10.1016/j.crad.2012.11.006. [DOI] [PubMed] [Google Scholar]
- 9.Kamisawa T, Takuma K, Anjiki H, Egawa N, Hata T, Kurata M, et al. Differentiation of autoimmune pancreatitis from pancreatic cancer by diffusion-weighted MRI. Am J Gastroenterol. 2010;105:1870–1875. doi: 10.1038/ajg.2010.87. [DOI] [PubMed] [Google Scholar]
- 10.Kartalis N, Lindholm TL, Aspelin P, Permert J, Albiin N. Diffusion-weighted magnetic resonance imaging of pancreas tumours. Eur Radiol. 2009;19:1981–1990. doi: 10.1007/s00330-009-1384-8. [DOI] [PubMed] [Google Scholar]
- 11.Muraoka N, Uematsu H, Kimura H, Imamura Y, Fujiwara Y, Murakami M, et al. Apparent diffusion coefficient in pancreatic cancer: characterization and histopathological correlations. J Magn Reson Imaging. 2008;27:1302–1308. doi: 10.1002/jmri.21340. [DOI] [PubMed] [Google Scholar]
- 12.Fattahi R, Balci NC, Perman WH, Hsueh EC, Alkaade S, Havlioglu N, et al. Pancreatic diffusion-weighted imaging (DWI): comparison between mass-forming focal pancreatitis (FP), pancreatic cancer (PC), and normal pancreas. J Magn Reson Imaging. 2009;29:350–356. doi: 10.1002/jmri.21651. [DOI] [PubMed] [Google Scholar]
- 13.Fukukura Y, Takumi K, Kamimura K, Shindo T, Kumagae Y, Tateyama A, et al. Pancreatic adenocarcinoma: variability of diffusion-weighted MR imaging findings. Radiology. 2012;263:732–740. doi: 10.1148/radiol.12111222. [DOI] [PubMed] [Google Scholar]
- 14.Kang KM, Lee JM, Yoon JH, Kiefer B, Han JK, Choi BI. Intravoxel incoherent motion diffusion-weighted MR imaging for characterization of focal pancreatic lesions. Radiology. 2014;270:444–453. doi: 10.1148/radiol.13122712. [DOI] [PubMed] [Google Scholar]
- 15.Koc Z, Erbay G. Optimal b value in diffusion-weighted imaging for differentiation of abdominal lesions. J Magn Reson Imaging. 2014;40:559–566. doi: 10.1002/jmri.24403. [DOI] [PubMed] [Google Scholar]
- 16.Concia M, Sprinkart AM, Penner AH, Brossart P, Gieseke J, Schild HH, et al. Diffusion-weighted magnetic resonance imaging of the pancreas: diagnostic benefit from an intravoxel incoherent motion model-based 3 b-value analysis. Invest Radiol. 2014;49:93–100. doi: 10.1097/RLI.0b013e3182a71cc3. [DOI] [PubMed] [Google Scholar]
- 17.Legrand L, Duchatelle V, Molinié V, Boulay-Coletta I, Sibileau E, Zins M. Pancreatic adenocarcinoma: MRI conspicuity and pathologic correlations. Abdom Imaging. 2015;40:85–94. doi: 10.1007/s00261-014-0196-8. [DOI] [PubMed] [Google Scholar]
- 18.Bilgili Y, Unal B. Effect of region of interest on interovserver variance in apparent diffusion coefficient measures. Am J Neuroradiol. 2004;25:108–111. [PMC free article] [PubMed] [Google Scholar]
- 19.Kim SH, Lee JY, Lee JM, Han JK, Choi BI. Apparent diffusion coefficient for evaluating tumour response to neoadjuvant chemoradiation therapy for locally advanced rectal cancer. Eur Radiol. 2011;21:987–995. doi: 10.1007/s00330-010-1989-y. [DOI] [PubMed] [Google Scholar]
- 20.Padhani AR, Liu G, Koh DM, Chenevert TL, Thoeny HC, Takahara T, et al. Diffusion-weighted magnetic resonance imaging as a cancer biomarker: consensus and recommendations. Neoplasia. 2009;11:102–125. doi: 10.1593/neo.81328. [DOI] [PMC free article] [PubMed] [Google Scholar]
- 21.Cohen J. Weighted kappa: nominal scale agreement with provision for scaled disagreement or partial credit. Psychol Bull. 1968;70:213–220. doi: 10.1037/h0026256. [DOI] [PubMed] [Google Scholar]
- 22.Bland JM, Altman DG. Statistical methods for assessing agreement between two methods of clinical measurement. Lancet. 1986;1:307–310. doi: 10.1016/S0140-6736(86)90837-8. [DOI] [PubMed] [Google Scholar]
- 23.Grothues F, Smith GC, Moon JC, Bellenger NG, Collins P, Klein HU, et al. Comparison of interstudy reproducibility of cardiovascular magnetic resonance with two-dimensional echocardiography in normal subjects and in patients with heart failure or left ventricular hypertrophy. Am J Cardiol. 2002;90:29–34. doi: 10.1016/S0002-9149(02)02381-0. [DOI] [PubMed] [Google Scholar]
- 24.Zhang X, Zhu C, Peng W, Tian B, Chen L, Teng Z, et al. Scan-rescan reproducibility of high resolution magnetic resonance imaging of atherosclerotic plaque in the middle cerebral artery. PLoS One. 2015;10:e0134913. doi: 10.1371/journal.pone.0134913. [DOI] [PMC free article] [PubMed] [Google Scholar]
- 25.Ma C, Liu L, Li J, Wang L, Chen LG, Zhang Y, et al. Apparent diffusion coefficient (ADC) measurements in pancreatic adenocarcinoma: A preliminary study of the effect of ROI on ADC values and inter-observer variability. J Magn Reson Imaging. 2016;43:407–413. doi: 10.1002/jmri.25007. [DOI] [PubMed] [Google Scholar]
- 26.Sun YS, Zhang XP, Tang L, Ji JF, Gu J, Cai Y, et al. Locally advanced rectal carcinoma treated with preoperative chemotherapy and radiation therapy: preliminary analysis of diffusion-weighted MR imaging for early detection of tumor histopathologic downstaging. Radiology. 2010;254:170–178. doi: 10.1148/radiol.2541082230. [DOI] [PubMed] [Google Scholar]
- 27.Liu L, Ma C, Li J, Wang L, Chen LG, Zhang Y, et al. Comparison of the diagnostic performances of three techniques of ROI placement for ADC measurements in pancreatic adenocarcinoma. Acad Radiol. 2015;22:1385–1392. doi: 10.1016/j.acra.2015.06.017. [DOI] [PubMed] [Google Scholar]
- 28.Dale BM, Braithwaite AC, Boll DT, Merkle EM. Field strength and diffusion encoding technique affect the apparent diffusion coefficient measurements in diffusion-weighted imaging of the abdomen. Invest Radiol. 2010;45:104–108. doi: 10.1097/RLI.0b013e3181c8ceac. [DOI] [PubMed] [Google Scholar]
- 29.Kartalis N, Loizou L, Edsborg N, Segersvärd R, Albiin N. Optimising diffusion-weighted MR imaging for demonstrating pancreatic cancer: a comparison of respiratory-triggered, free-breathing and breath-hold techniques. Eur Radiol. 2012;22:2186–2192. doi: 10.1007/s00330-012-2469-3. [DOI] [PubMed] [Google Scholar]
- 30.Ma C, Pan CS, Zhang HG, Wang H, Wang J, Chen SY, et al. Diffusion-weighted MRI of the normal adult pancreas: the effect of age on apparent diffusion coefficient values. Clin Radiol. 2013;68:e532–537. doi: 10.1016/j.crad.2013.05.100. [DOI] [PubMed] [Google Scholar]
- 31.Wang Y, Chen ZE, Nikolaidis P, McCarthy RJ, Merrick L, Sternick LA, et al. Diffusion-weighted magnetic resonance imaging of pancreatic adenocarcinomas: association with histopathology and tumour grade. J Magn Reson Imaging. 2011;33:136–142. doi: 10.1002/jmri.22414. [DOI] [PubMed] [Google Scholar]
- 32.Momtahen AJ, Balci NC, Alkaade S, Akduman EI, Burton FR. Focal pancreatitis mimicking pancreatic mass: magnetic resonance imaging (MRI)/magnetic resonance cholangiopancreatography (MRCP) findings including diffusion-weighted MRI. Acta Radiol. 2008;49:490–497. doi: 10.1080/02841850802014602. [DOI] [PubMed] [Google Scholar]
- 33.Donati OF, Chong D, Nanz D, Boss A, Froehlich JM, Andres E, et al. Diffusion-weighted MR imaging of upper abdominal organs: field strength and intervendor variability of apparent diffusion coefficients. Radiology. 2014;270:454–463. doi: 10.1148/radiol.13130819. [DOI] [PubMed] [Google Scholar]
Associated Data
This section collects any data citations, data availability statements, or supplementary materials included in this article.
Data Availability Statement
Please contact author for data requests.