
Fig. 1.
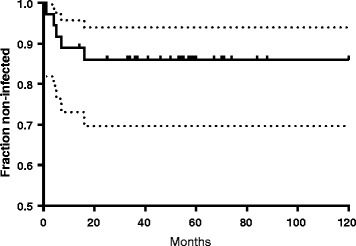
Probability of cure. Kaplan-Meier survival curves of the total group of 36 patients. Tick marks indicate patients censored due to loss of follow-up or infection-unrelated events. Dotted lines indicate confidence intervals
Official websites use .gov
A
.gov website belongs to an official
government organization in the United States.
Secure .gov websites use HTTPS
A lock (
) or https:// means you've safely
connected to the .gov website. Share sensitive
information only on official, secure websites.
Probability of cure. Kaplan-Meier survival curves of the total group of 36 patients. Tick marks indicate patients censored due to loss of follow-up or infection-unrelated events. Dotted lines indicate confidence intervals