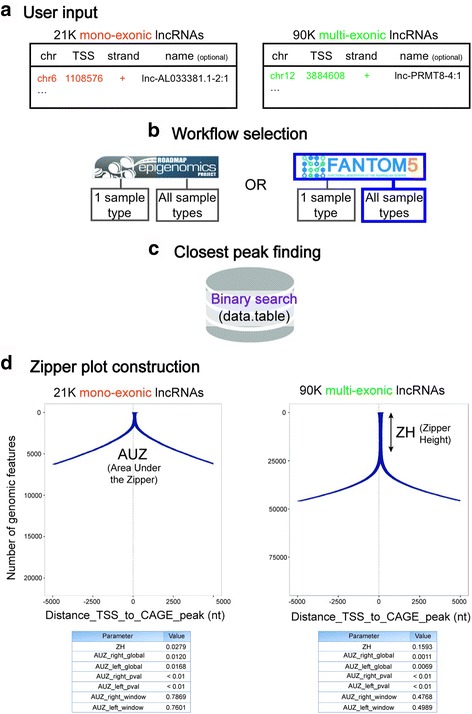
Fig. 3.

Fewer mono-exonic lncRNAs have CAGE-seq peaks overlapping with their TSSs compared to multi-exonic lncRNAs. This is reflected in smaller Zipper Height (ZH) and higher Area Under the Zipper (AUZ) values. a) As described in the “Database querying” section, users may provide an additional fourth column in the input file with labels for each TSS (optional). b) FANTOM5 data (CAGE-seq) and “All sample types” workflow was selected. c) The data.table package was used to retrieve the closest CAGE-seq peak to each TSS. d) Peaks are ranked based on the distance from the TSS to the closest peak and a Zipper plot is generated. Since both plots are visualized in a +/− 5 kb window, AUZ_window values can be directly compared: smaller values (multi-exonic lncRNAs) represent higher evidence of independent transcriptional activity for the set of genomic features being studied. This conclusion can also be made looking at the ZH values: a bigger ZH value means a higher proportion of lncRNAs with a CAGE peak overlapping with the TSS. Finally, both AUZ_right_pval and AUZ_left_pval are smaller than 0.01, so it is unlikely that the set of TSSs from mono and multi-exonic lncRNAs were randomly selected
