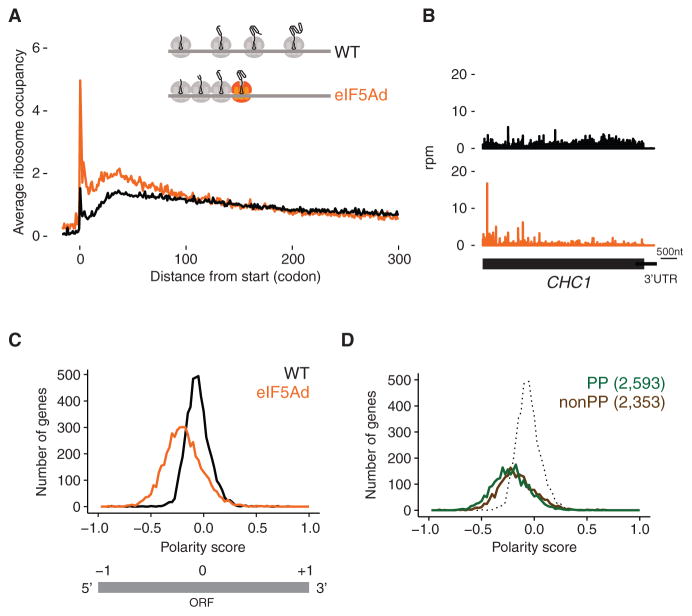
Figure 1. Polar Distribution of Ribosomes toward 5′ End of Genes in eIF5Ad Cells.
(A) Average ribosome occupancy from all genes aligned at start codons for WT (black line) and eIF5Ad cells (orange line) with schematic depicting queuing of ribosomes upstream of a paused ribosome (colored orange). Ribosome occupancy was normalized to show a mean value of 1 for each codon.
(B) Example of ribosome occupancy along CHC1 gene in WT.1 (black) and eIF5Ad.1 (orange) cells. Rpm, reads per million.
(C) Distributions of polarity scores for 4,946 genes from WT and eIF5Ad cells are plotted, for genes with at least 64 reads per dataset in ORFs (top panel). Schematic representation of polarity score (bottom panel).
(D) Distributions of polarity scores for genes containing Pro-Pro dipeptide motifs (green) and genes lacking these motifs (brown) in eIF5Ad cells. WT distribution (includes both PP and non-PP) is included for reference (dotted). Numbers in parentheses denote the gene numbers included in the analysis. See also Figures S1 and S2.

