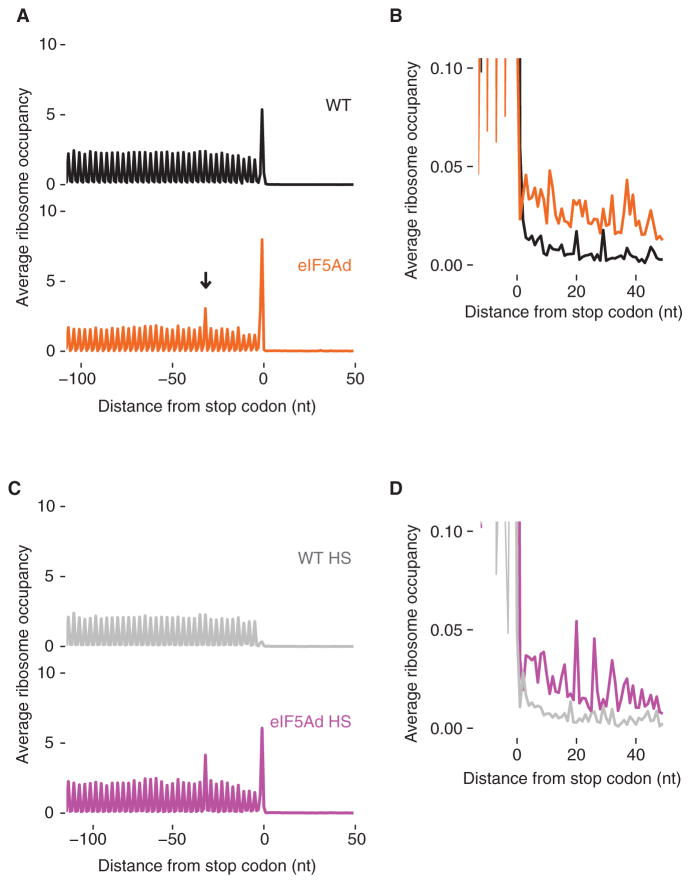
Figure 5. Ribosomes Accumulate at Stop Codons and in 3′ UTRs in eIF5Ad Cells.
(A) Metagene analysis of translation termination. Average ribosome occupancy from all genes aligned at their stop codons for WT and eIF5Ad cells. Arrow denotes stacked ribosomes ~30 nt upstream the stop codon peak.
(B) Overlay and close-up view of (A), showing accumulated ribosomes in 3′ UTRs in eIF5Ad cells.
(C) Similar to (A), metagene plot of stop codons for WT and eIF5Ad lysates treated with high-salt buffer.
(D) Similar to (B), close-up view of 3′ UTR regions for WT and eIF5Ad lysates after high-salt wash. See also Figure S5.

