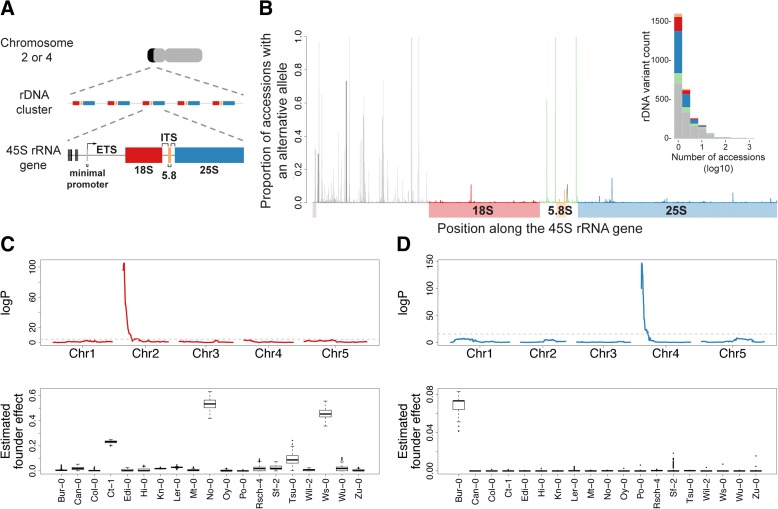
Fig. 1.
Identification and annotation of polymorphisms along the 45S rRNA gene. a Schematic illustration of the positioning of the rDNA clusters (in black) at the distal end region of chromosomes 2 or 4 (in gray) in A. thaliana, the head-to-tail tandem arrangement of the 45S rRNA genes, and the structure of each ~10 kb long 45S rRNA gene. b Proportion of accessions in the population (1138 individuals; see “Methods”) carrying a variable site (present in > 5% of copies within an individual) along the 45S rRNA gene. Vertical lines represent SNPs or deletions in the minimal promoter (purple), 5’ETS (gray), 18S (red), ITSs (green), 5.8S (yellow), and 25S (blue) regions along the 45S rRNA gene. Black lines depict insertions. Inset shows the distribution of rRNA gene variants shared across accessions, where the number of accessions is displayed in log10 scale. c Example of linkage mapping of the abundance of an 18S variable site (position 2882, T to C) estimated by DNA-sequence coverage in 393 individuals of the MAGIC population (top). Estimated founder accession effect by multiple imputation using R/happy [47, 90] at the major quantitative trait locus from the top panel (bottom). d Similar to (c), but for a 25S variable site (position 6661, G to A)

