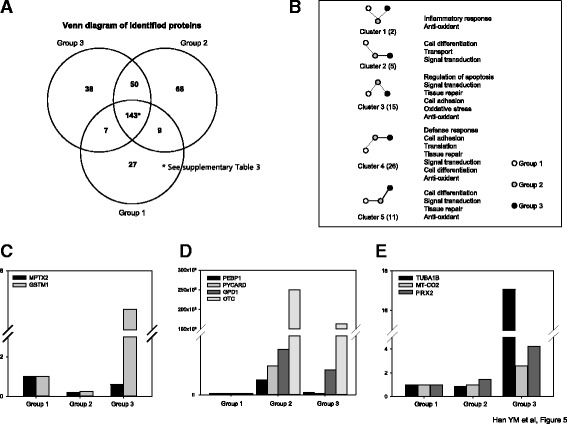
Fig. 5.

Label-free quantification analysis to detect biomarkers. a Venn diagram of identified proteins according to groups. b Gene ontology categories and the number of genes with expression differences are depicted in the boxes. c-e Novel biomarkers of each group following Table 1. GPD1 glycerol 3-phosphate dehydrogenase [NAD (+)], cytoplasmic, GST mu 1, glutatione-S-transferase mu 1, MT-CO2 cytochrome c oxidase subunit 2OTC ornithine carbamoyltransferase, mitochondria PEBP1 phosphatidylethanolamine-binding protein 1; PRDX-2 peroxiredoxin-2, PYCARD apoptosis-associated speck-like protein containing CARD, TUBA1B tubulin-α-1B chain; MPTX mucosal pentraxin protein
