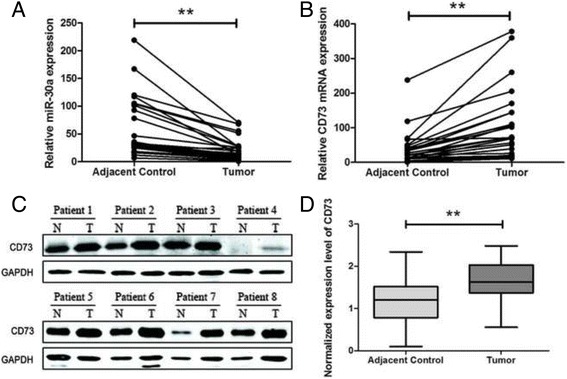
Fig. 3.

The inverse correlation between the expression levels of miR-30a and CD73 in 27 pairs of clinical specimens. qRT-PCR analyses of miR-30a (a) and CD73 (b) expression in CRC and corresponding adjacent control tissues. c CD73 protein expression levels in CRC tissues were determined by western blot (results of 8 patients were shown). d Densitometry analysis of western blot data normalized with GAPDH in all specimens (**P < 0.01)
