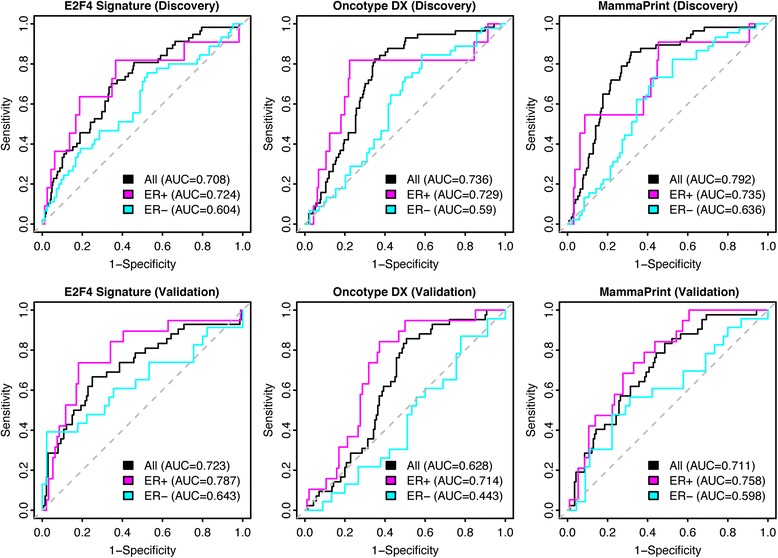
Fig. 3.

Comparison of pCR classification performance between the E2F4, Oncotype DX, and MammaPrint signatures in the Hatzis discovery and validation patient cohorts. pCR classification performance was evaluated using the E2F4, Oncotype DX, and Mammaprint signatures. ROC curves were plotted for all (black), ER+ (magenta) and ER- (aqua) patients. Grey dotted line indicates random classification performance
