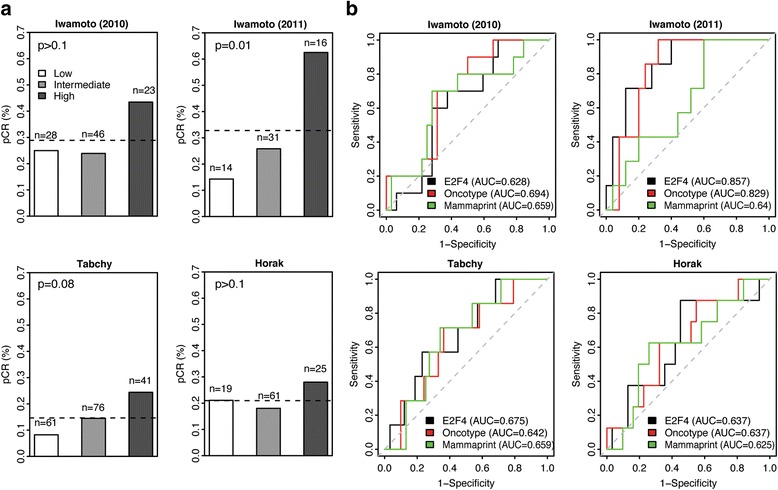
Fig. 5.

Comparison of pCR classification performance between the E2F4 signature, Oncotype DX, and MammaPrint in 4 independent datasets. a Percentage of pCR patients in low (white), intermediate (grey), and high (dark grey) E2F4 activity groups in the Iwamoto (2010), Iwamoto (2011), Tabchy, and Horak datasets. P-values were calculated using the χ2 test. b pCR classification performance using features from the E2F4 signature (black), Oncotype DX (red), and MammaPrint (green) in the Iwamoto (2010), Iwamoto (2011), Tabchy, and Horak datasets. Grey dotted line corresponds to random classification and an AUC of 0.5
