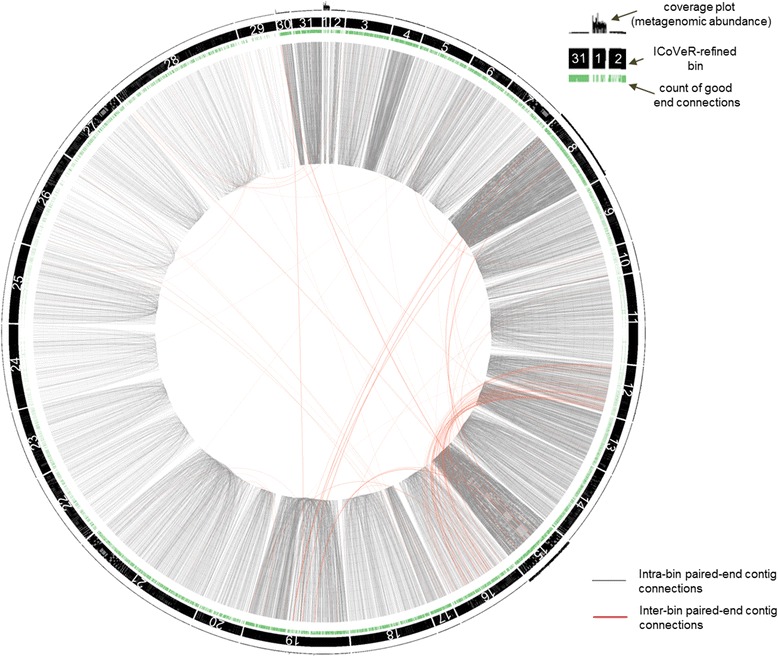
Fig. 2.

Visual representation of the paired-end connections for contigs grouping into the resulting genome bins for the AD microbiome dataset. Intra- (between the contigs inside the same bin) and inter-bin (between the contigs assigned to two different bins) paired-end contig connections are displayed as grey and red lines, respectively
