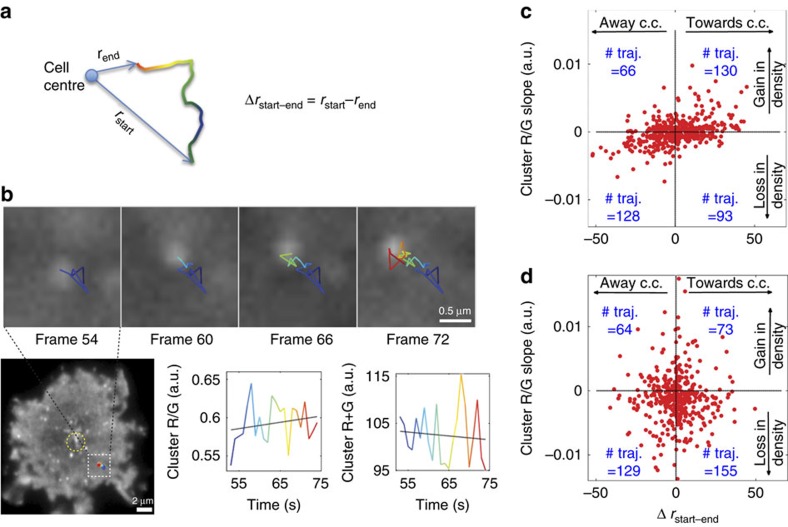
Figure 5. Tracking TCR cluster movement and density during T-cell activation.
(a) Tracking analysis to determine directionality of CD3ζ-CliF clusters: Δrstart-end measures cluster movement towards or away from the cell centre. The trajectory is colour-coded from blue to red to indicate positions over time. (b) Representative trajectory of a CD3ζ-CliF cluster (white dotted square in cell image) some distance from the cell centre (yellow circle in cell image) and the resulting R/G and R+G traces for this trajectory. The slopes of the R/G and R+G trajectories were extracted (black line) by linear regression. Scale bar, 2 μm, and 0.5 μm in the zoomed in images in b. (c,d) Scatter plot of the R/G slopes versus the Δrstart-end values of ∼400 TCR trajectories for cells activated on pMHC-presenting lipid bilayers (c) and antibody (anti-CD3+anti-CD28 Ab)-coated surfaces (d). Scatter plots were divided into four quadrants, corresponding to gain/loss of cluster density and movement to/away from cell centre (c.c.). The number of trajectories in each quadrant is stated. Data shown in c,d is analysis from a single cell. 5 cells were analysed under each conditions.

