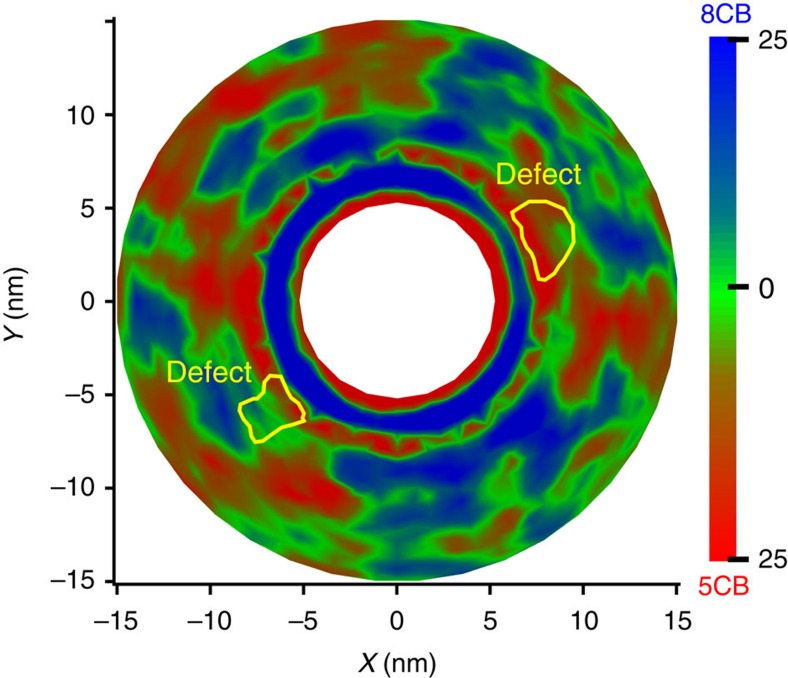
Figure 5. Segregation of 5CB/8CB mixture.
The composition profile shows the concentration of 8CB and 5CB molecules in the system. It is given by  , where ρ8CB and ρ5CB are the 8CB and 5CB density, respectively. The concentration of 8CB molecules in one layer around the cylinder is around 25% higher than that of 5CB. This layer is followed by a layer with higher concentration of 5CB molecules.

