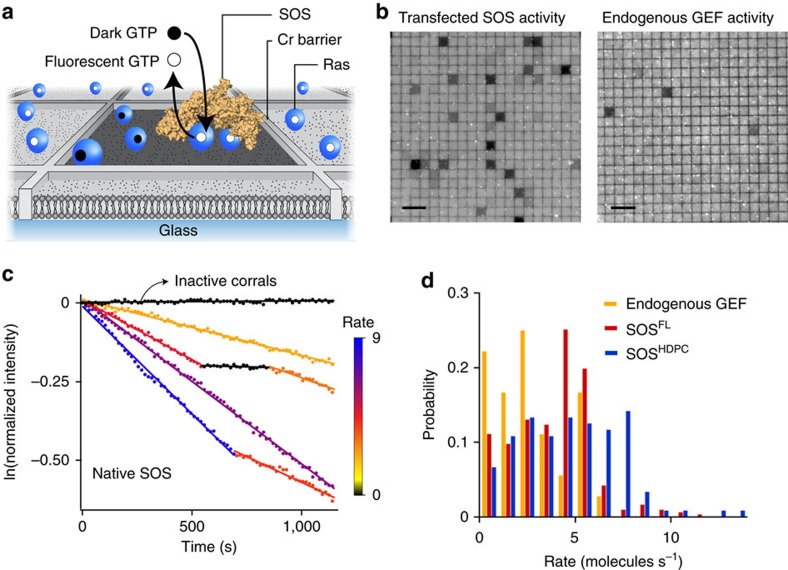
Figure 2. The PR domain does not significantly alter single-molecule nucleotide exchange kinetics of SOS.
(a) Scheme of the single-molecule SOS activity assay. Membrane-tethered Ras molecules, bound to fluorescent nucleotides, are laterally confined in an array of micrometer-scale supported lipid bilayers that are partitioned by nanofabricated chromium metal lines. Stably recruited SOS catalyses nucleotide exchange for excess non-fluorescent nucleotide present in solution. (b) Epifluorescence images of fluorescently loaded Ras on a partitioned bilayer, at the end of the observation. A subset of corrals underwent nucleotide exchange and became dark. Nucleotide exchange by SOS from transfected and untransfected cell lysates are shown on the left and right, respectively. (c) Single-enzyme kinetic traces for native SOS. Discrete activity states are identified as linear segments with distinct slopes. Each enzymatic state is colour-coded according to its catalytic rate (molecules s−1). (d) Catalytic rate probability distributions of endogenous GEF (yellow; average and s.d. of rates: 2.79±1.76 molecules s−1), native full-length SOS (red; 3.89±1.98 molecules s−1) and SOSHDPC (blue; 4.68±2.65 molecules s−1). N of active corrals: ∼150 for each SOSFL and SOSHDPC, ∼80 for endogenous GEF. Lipid composition (in mol%): egg-PC/MCC-DOPE/DOPS=94/3/3. Surface density of Ras: ∼800 μm−2. Scale bars, 10 μm.

