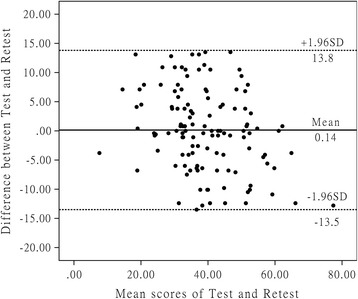
Fig. 1.

These are Bland-Altman plots of test-retest reliability of the C-WORC. Each data point indicates how the difference between the two test sessions for an individual patient compares to the mean of the two sessions for scores of each C-WORC. The interval of two sessions was 1 week. The dashed line shows the 95% (±1.96 SD) limits of agreement
