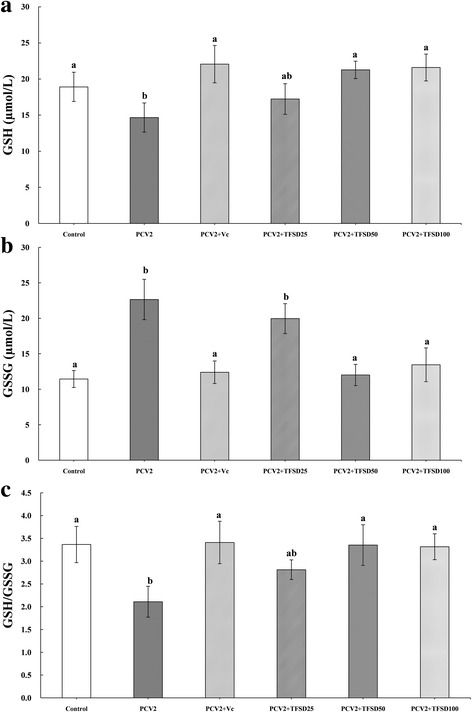
Fig. 3.

Effect of TFSD on intracellular GSH concentration (a), GSSG content (b) and GSH/GSSG ratio (c) in PCV2 infected RAW264.7 cells. Data are presented as mean ± S.D. Bars with different letters are statistically different (P < 0.05). Control: cells without PCV2 infection and drug treatment; PCV2: cells infected with 102.7 TCID50 PCV2; PCV2 + Vc: cells treated with 100 μg/mL of vitamin C after PCV2 infection; PCV2 + TFSD25–100: cells treated with TFSD at concentrations of 25, 50 or 100 μg/mL after PCV2 infection, respectively
