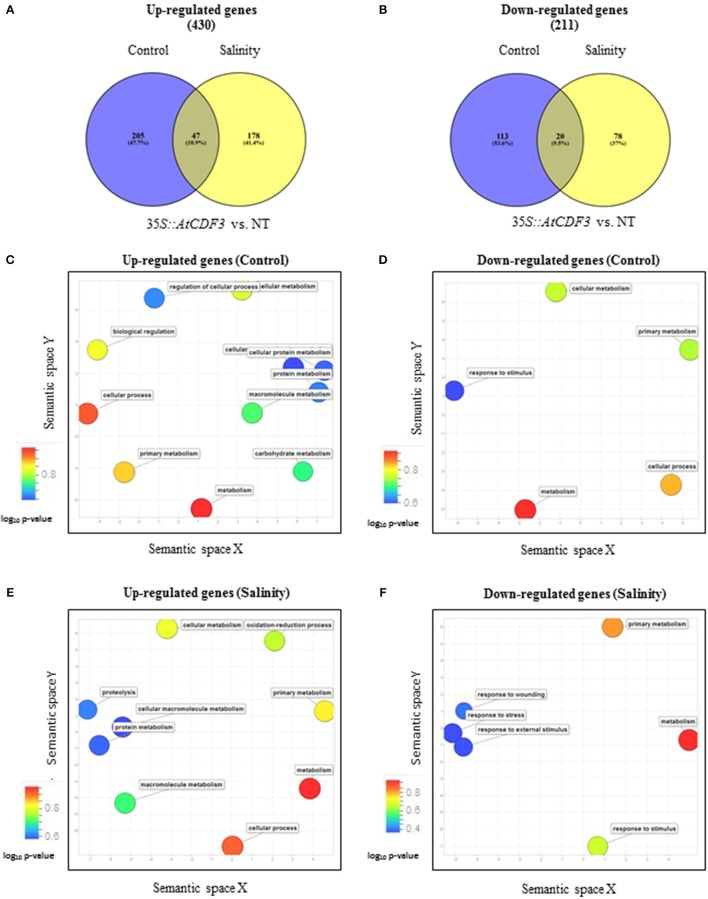
Figure 2.
Classification and gene ontology analyses of the genes differentially expressed in the 35S::AtCDF3 plants compared to the NT plants under control and salinity conditions. Thirty-day-old NT and 35S::AtCDF3 plants grown in hydroponic culture were subjected to moderate salinity (75 mM NaCI). Leaf transcriptomic analysis was performed after 15 days. (A,B) Venn diagrams showing the overlap of the up-regulated and down-regulated genes expressed in the 35S::CDF3 transgenic plants vs. the NT plants in response to salinity. (C–F) Scatter plot of the genes significantly (P < 0.05) up- or down-regulated in the 35S::AtCDF3 plants compared with the non-transformed NT plants under control and salinity conditions. The GO analysis was performed using the AgriGO and Revigo tools. Bubble color indicates the P-value for the false discovery rates derived from the AgriGO analysis as well as biological processes. NT, non-transformed.

