
Fig. 6. Oscillatory localization of TMEM24 at the PM affects insulin secretion in insulinoma cells.
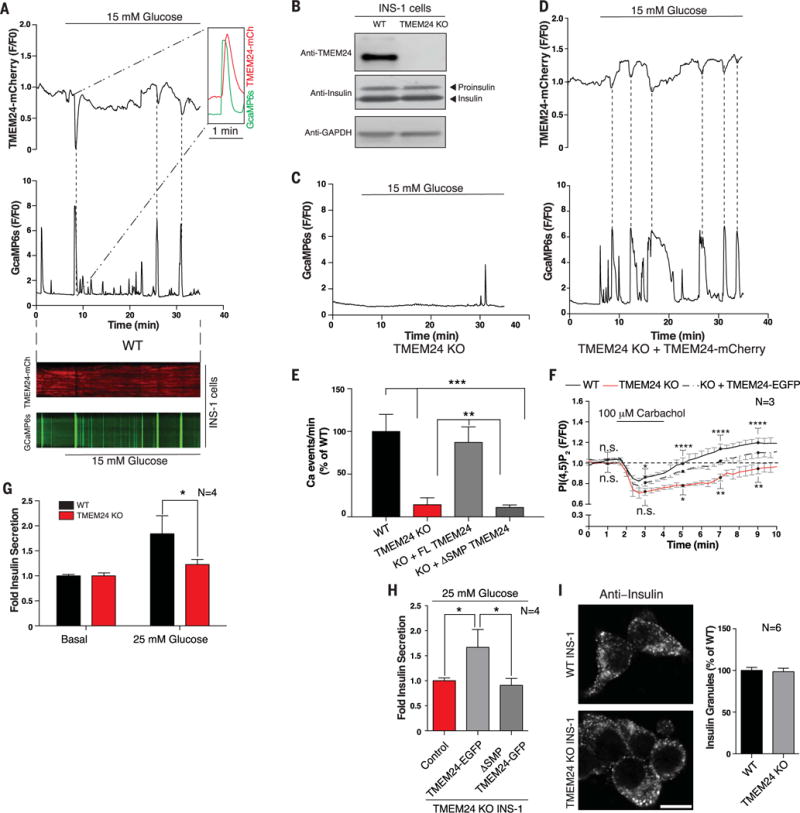
(A) (Top) High-glucose stimulation of WT INS1 cells triggers oscillations of TMEM24 (TMEM24-mCherry, top) and calcium (GcaMP6s, bottom) opposite in phase as monitored by TIRF microscopy. (Inset) Depletion of TMEM24 (peak inverted) reaches maximum after the peak of calcium influx. Dotted lines indicate corresponding peaks. (Bottom) Kymograph shows that TMEM24 and calcium oscillations are opposite in phase after glucose stimulation. (B) WT and TMEM24 KO INS1 cell lysates were resolved by SDS-PAGE and immunoblotted with antibodies against TMEM24 and insulin, showing no difference in insulin biogenesis in the KO cells. Top band in anti-insulin panel is proinsulin, whereas bottom band is insulin. GAPDH was used as a loading control. (C) Calcium oscillations (monitored by GcaMP6s) are abrogated after glucose stimulation in TMEM24 KO INS1 cells. (D) Exogenous overexpression of TMEM24-mCherry in KO cells rescues glucose-induced calcium oscillations. Dotted lines indicate corresponding peaks. (E) Quantitation of Ca2+ oscillations per minute in WT, TMEM24 KO, and TMEM24 KO INS1 cells rescued with either full-length or ΔSMP TMEM24 upon glucose stimulation. (F) Dynamics of PI(4,5)P2 recovery in WT (black) and TMEM24 KO (red) INS1 cells overexpressing PI(4,5)P2 marker iRFP-PHPLCδ after treatment with carbachol to deplete PI(4,5)P2 at the PM. TMEM24 KO cells show delayed recovery of basal PI(4,5)P2 level at the PM. This delay is rescued by exogenous overexpression of TMEM24-EGFP (dashed line). Black dots indicate time points for which significance is reported (n.s., no significant difference; *P < 0.05; **P < 0.01; ****P < 0.0001). Significances of difference for WT versus KO and KO versus KO+TMEM24 are indicated above and below traces, respectively. (G) Amount of secreted insulin from WT or TMEM24 KO INS1 cells after glucose stimulation was assayed by ELISA. Stimulated insulin secretion was normalized to secretion under basal conditions (mean ± SEM). (H) TMEM24 KO INS1 cells were transfected with full-length TMEM24-EGFP or ΔSMP-TMEM24, and insulin secretion was assayed by ELISA. Only TMEM24 containing the lipid-transfer module was able to rescue insulin secretion. (I) Anti-insulin immunofluorescence of WT (top) and TMEM24 KO (bottom) INS1 cells shows that the typical punctate distribution of insulin granules is not perturbed by loss of TMEM24 expression (as quantified at right). Scale bar is 5 μm. P values are 0.0003 for WTversus TMEM24 KO, 0.0005 for WTversus KO+ΔSMP, 0.0019 for KO versus KO+FL TMEM24, and 0.0029 for KO+FL TMEM24 versus KO+ΔSMP in (E), 0.0408 in (G), and 0.0428 for control versus FL TMEM24 and 0.0031 for FL TMEM24 versus ΔSMP in (H).