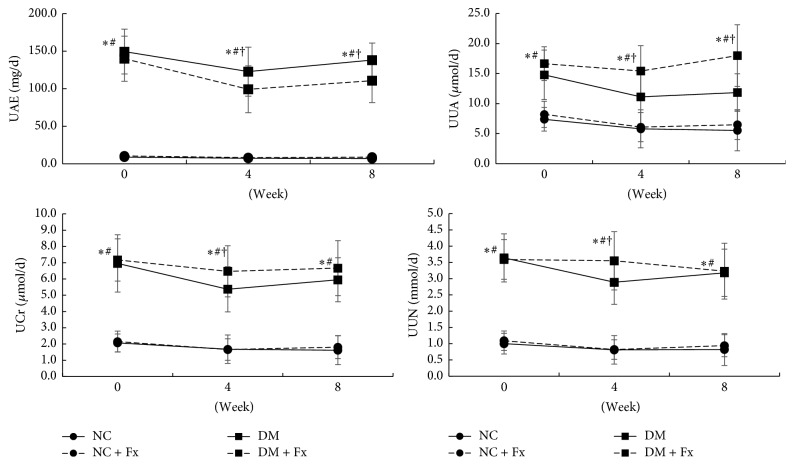
Figure 4.
Time course of daily urinary excretions among the four rat groups. The circle with solid and dashed lines represents NC and NC + Fx groups, respectively, while the block symbol with solid and dashed lines shows data of DM and DM + Fx groups, respectively. Data are expressed as mean ± SD. Statistical significance (P < 0.05) was labeled as ∗, #, and † correspondingly, when the DM + Fx group was compared with NC, NC + Fx, and DM groups.

